plot.CARP provides a range of ways to visualize the results of convex
clustering, including:
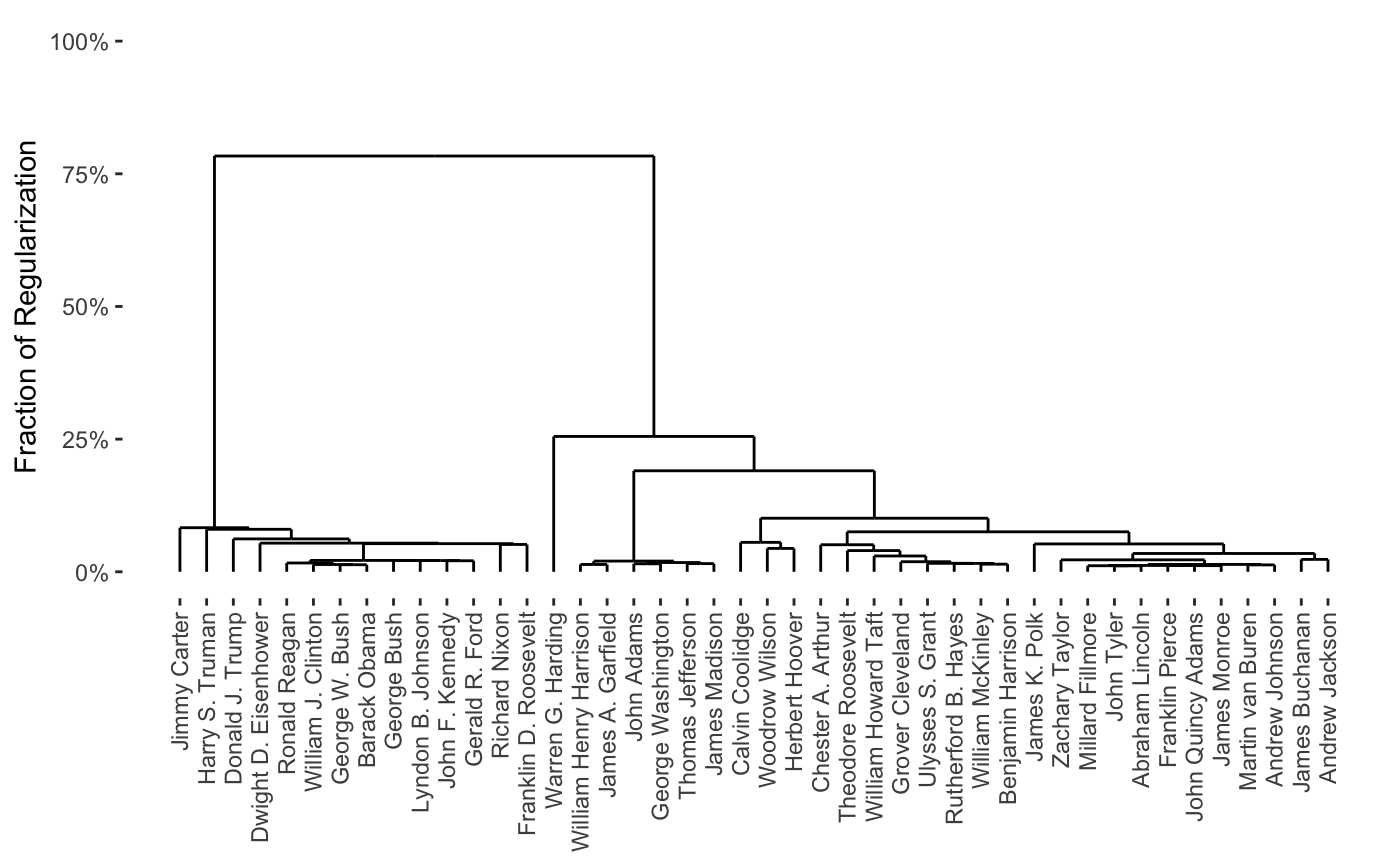
A dendrogram, illustrating the nested cluster hierarchy inferred from the convex clustering solution path (
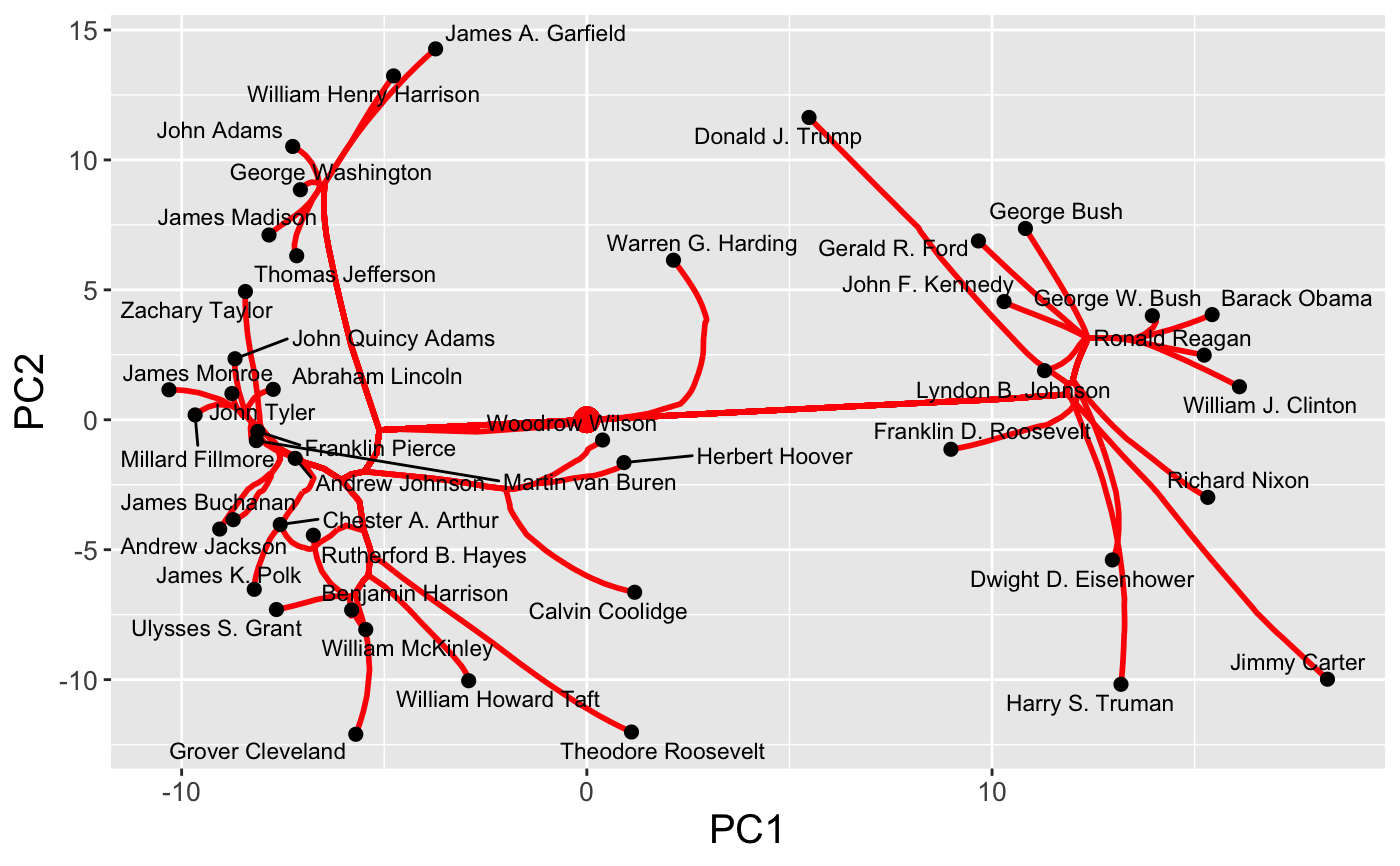
type = "dendrogram");A static path plot, showing the coalescence of the estimated cluster centroids at a fixed value of the regularization parameter is increased (
type = "path");A
gganimateplot, showing the coalescence of the estimated cluster centroids as the regularization parameter is increased (dynamic = TRUE)
# S3 method for CARP
plot(
  x,
  ...,
  type = c("dendrogram", "path", "heatmap"),
  dynamic = FALSE,
  interactive = FALSE,
  axis = c("PC1", "PC2"),
  percent,
  k,
  percent.seq = seq(0, 1, 0.01),
  slider_y = -0.3,
  refit = FALSE
)
Arguments
| x | An object of class |
|---|---|
| ... | Additional arguments, which are handled differently for different
values of
See the documentation of |
| type | A string indicating the type of visualization to show (see details above). |
| dynamic | A logical scalar.Should the resulting animation be dynamic (animated) or not?
If |
| interactive | A logical scalar. Should the resulting animation be interactive or not?
If |
| axis | A character vector of length two indicating which features or principal
components to use as the axes in the |
| percent | A number between 0 and 1, giving the regularization level (as
a fraction of the final regularization level used) at which to
assign clusters in the static ( |
| k | An integer indicating the desired number of clusters to be displayed
in the static plots. If no |
| percent.seq | A grid of values of percent along which to generate dynamic visualizations (if dynamic == TRUE) |
| slider_y | A number to adjust the slider's vertical position for interactive dendrogram and interactive heatmap plots (ignored for other plot types). |
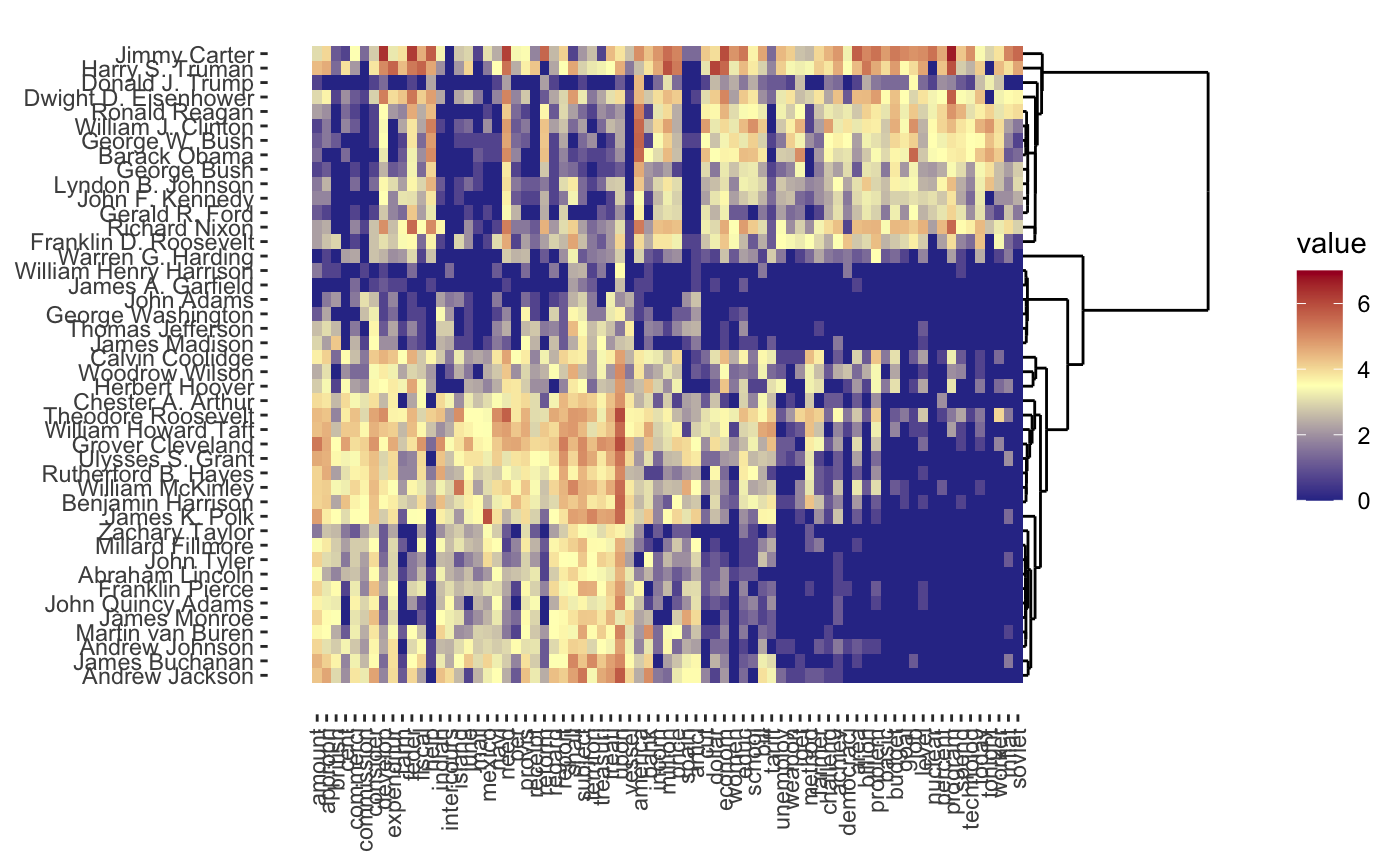
| refit | A logical scalar. Should "naive" centroids (TRUE) or the actual centroids estimated by convex clustering be used? When the default refit = FALSE, the estimated U from the convex clustering problem is used. The refit = TRUE returns actual centroids (mean) of all elements assigned to that cluster; Due to the global shrinkage imposed, these clusters are more "shrunk together" than the naive clusters. Only for the heatmap plots. (ignored for other plot types). |
Value
The value of the return type depends on the interactive and dynamic arguments:
if
interactive = FALSEanddynamic = FALSE, an object of classggplotis returned;if
interactive = FALSEanddynamic = TRUE, an object of classgganimis returned;if
interactive = TRUE, an object of classplotlyis returned.
All the plots can be plotted directly (by invoking its print method) or further manipulated by the user.
Examples
#>#>#>