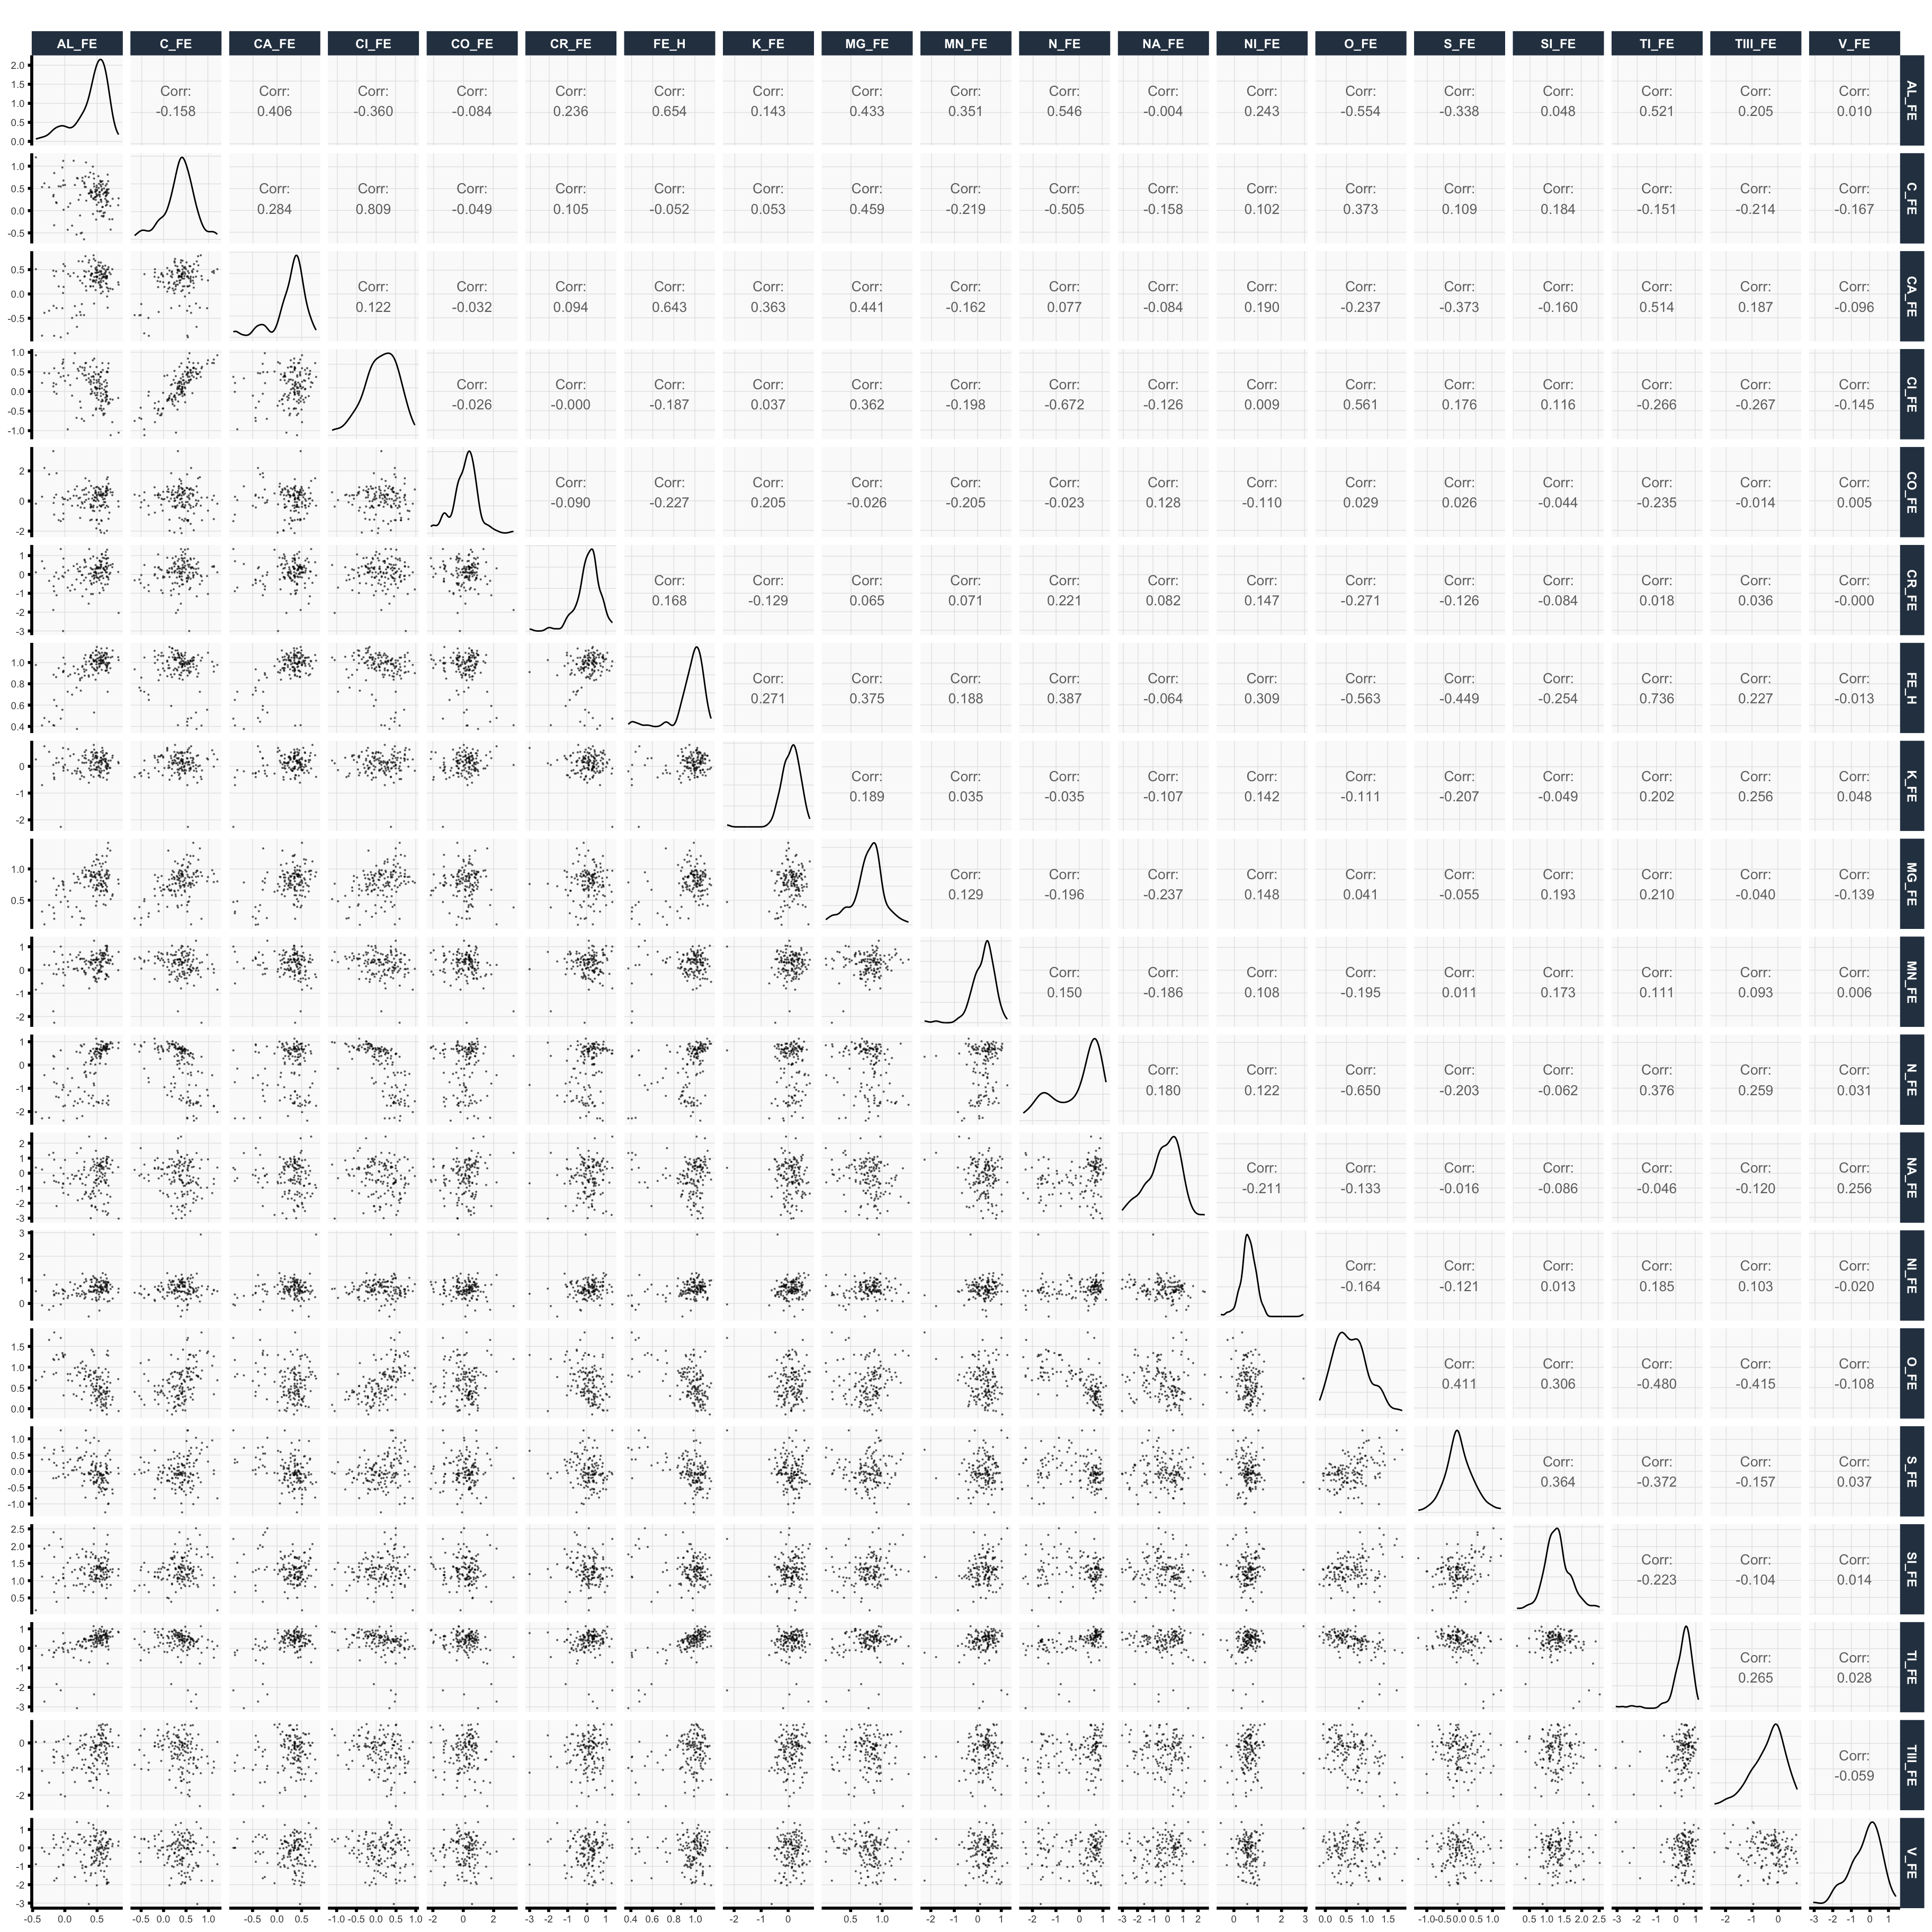
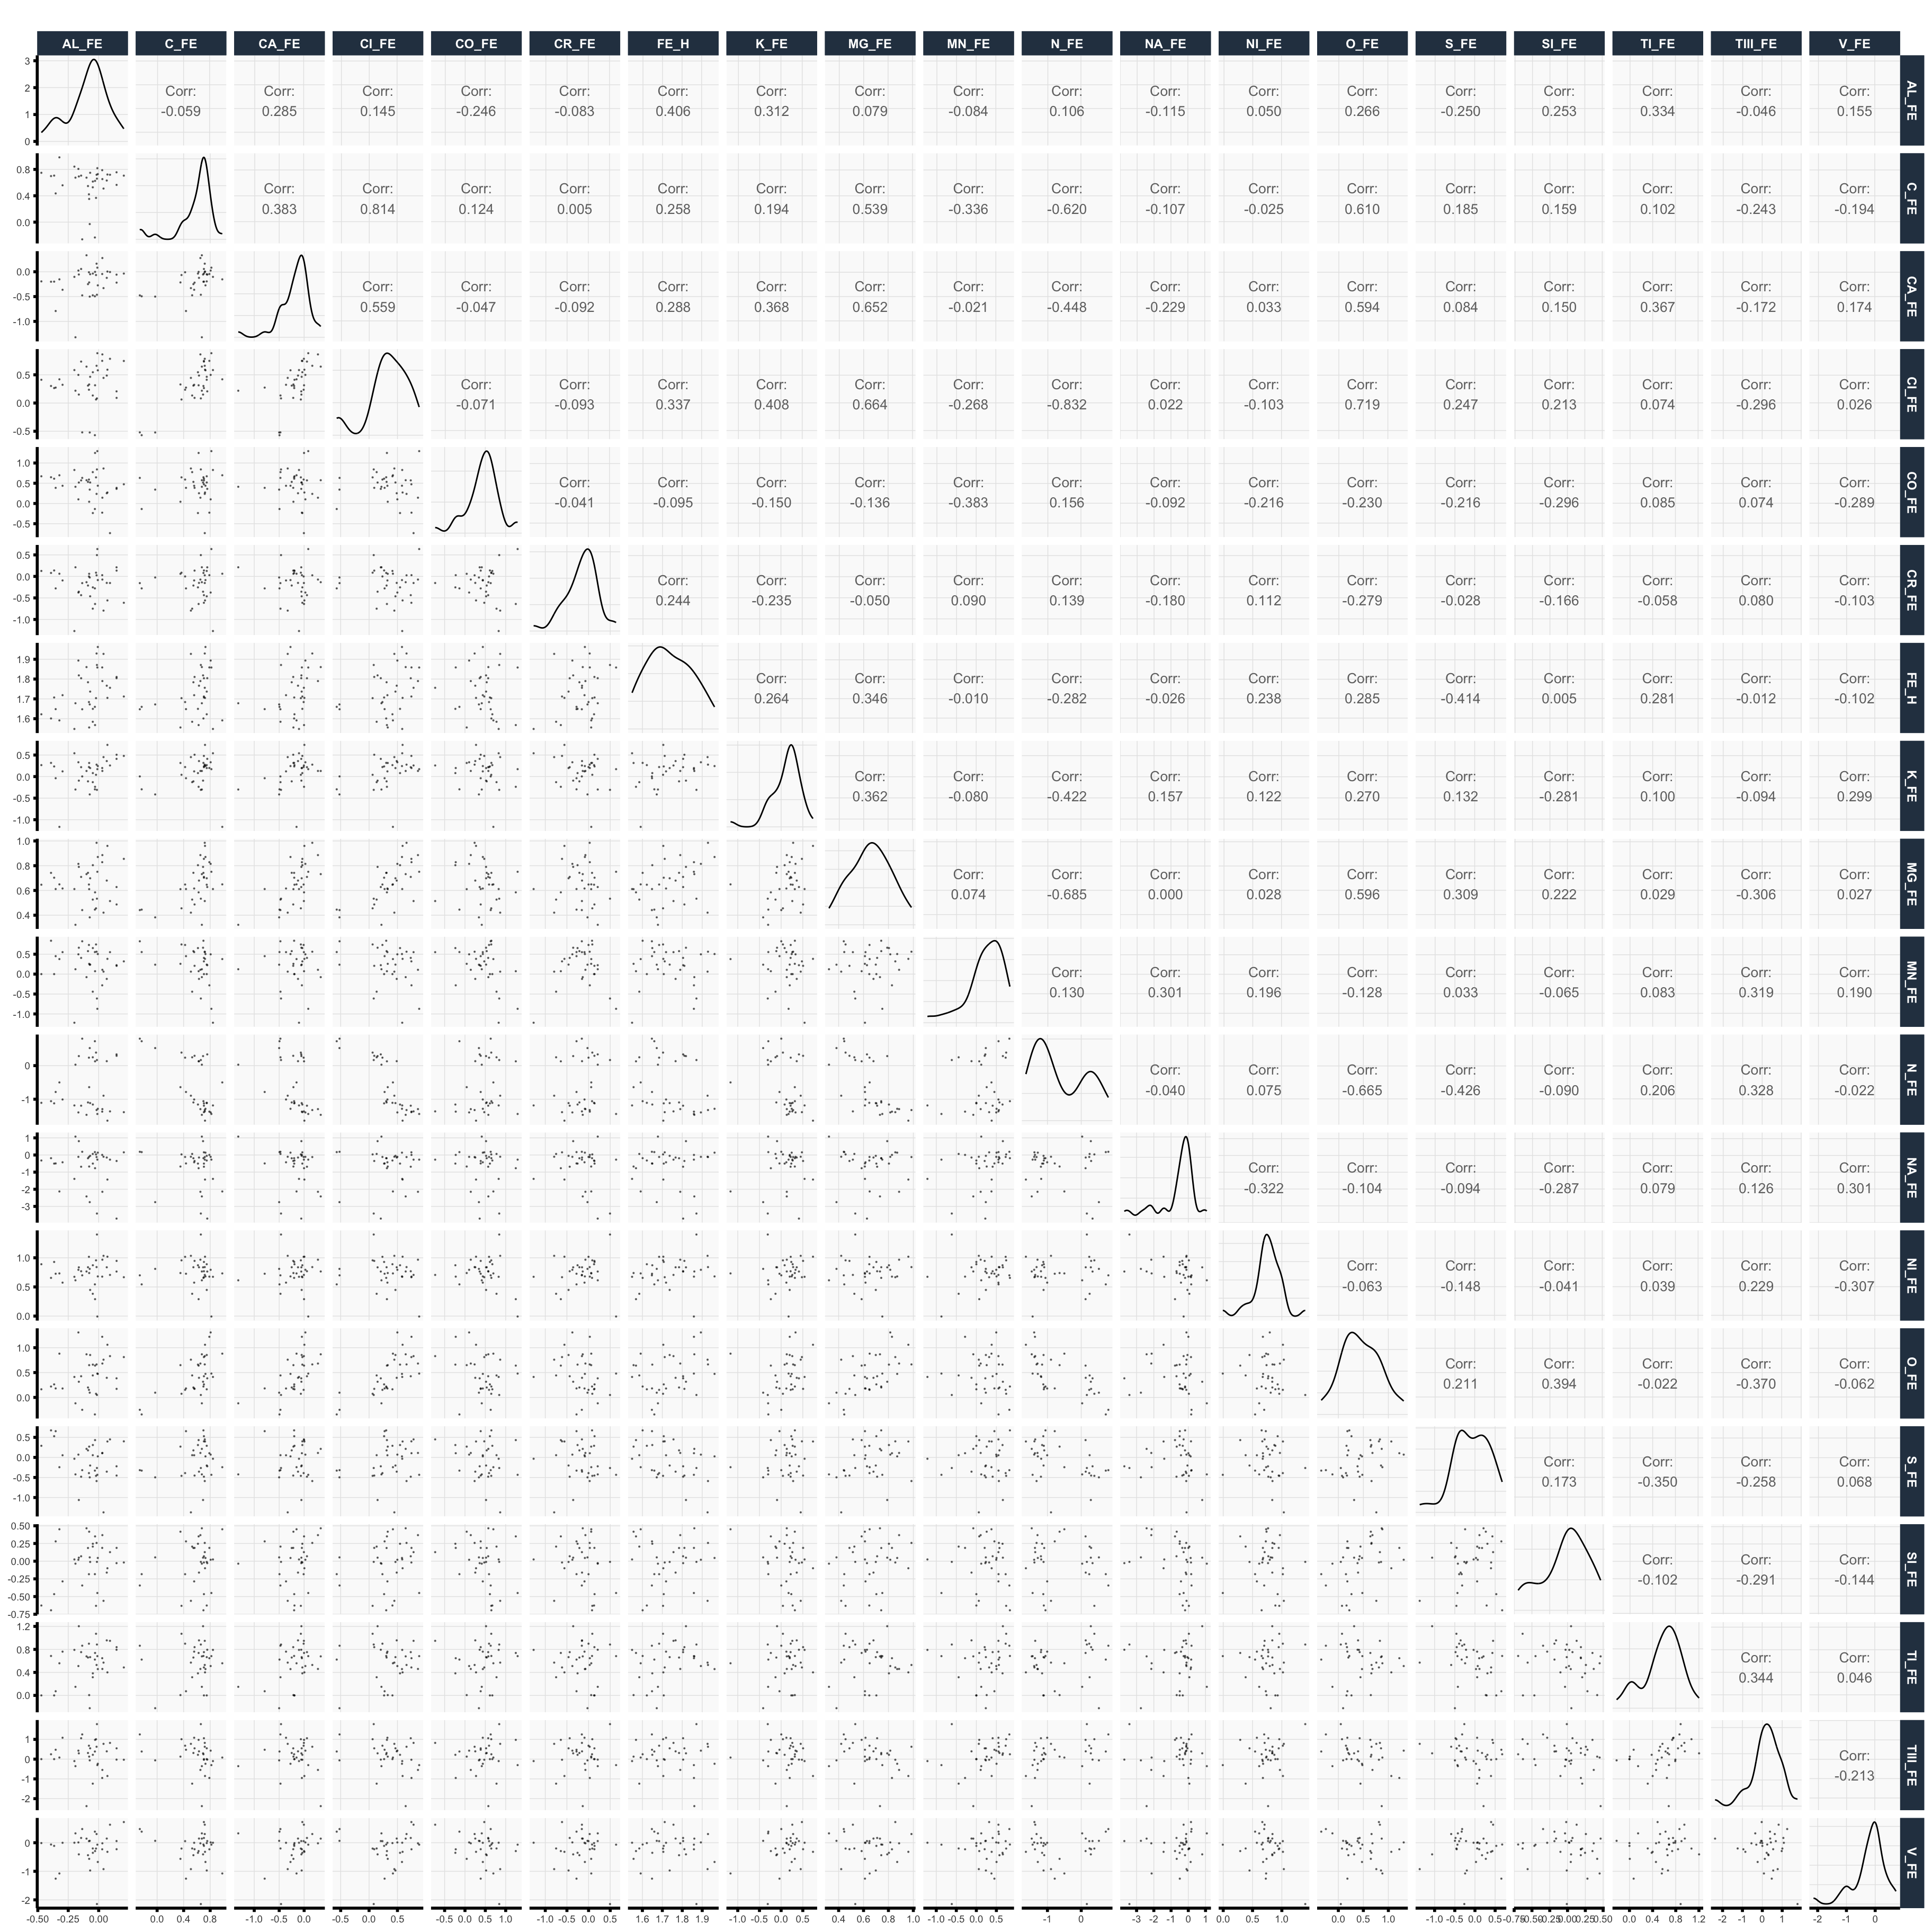
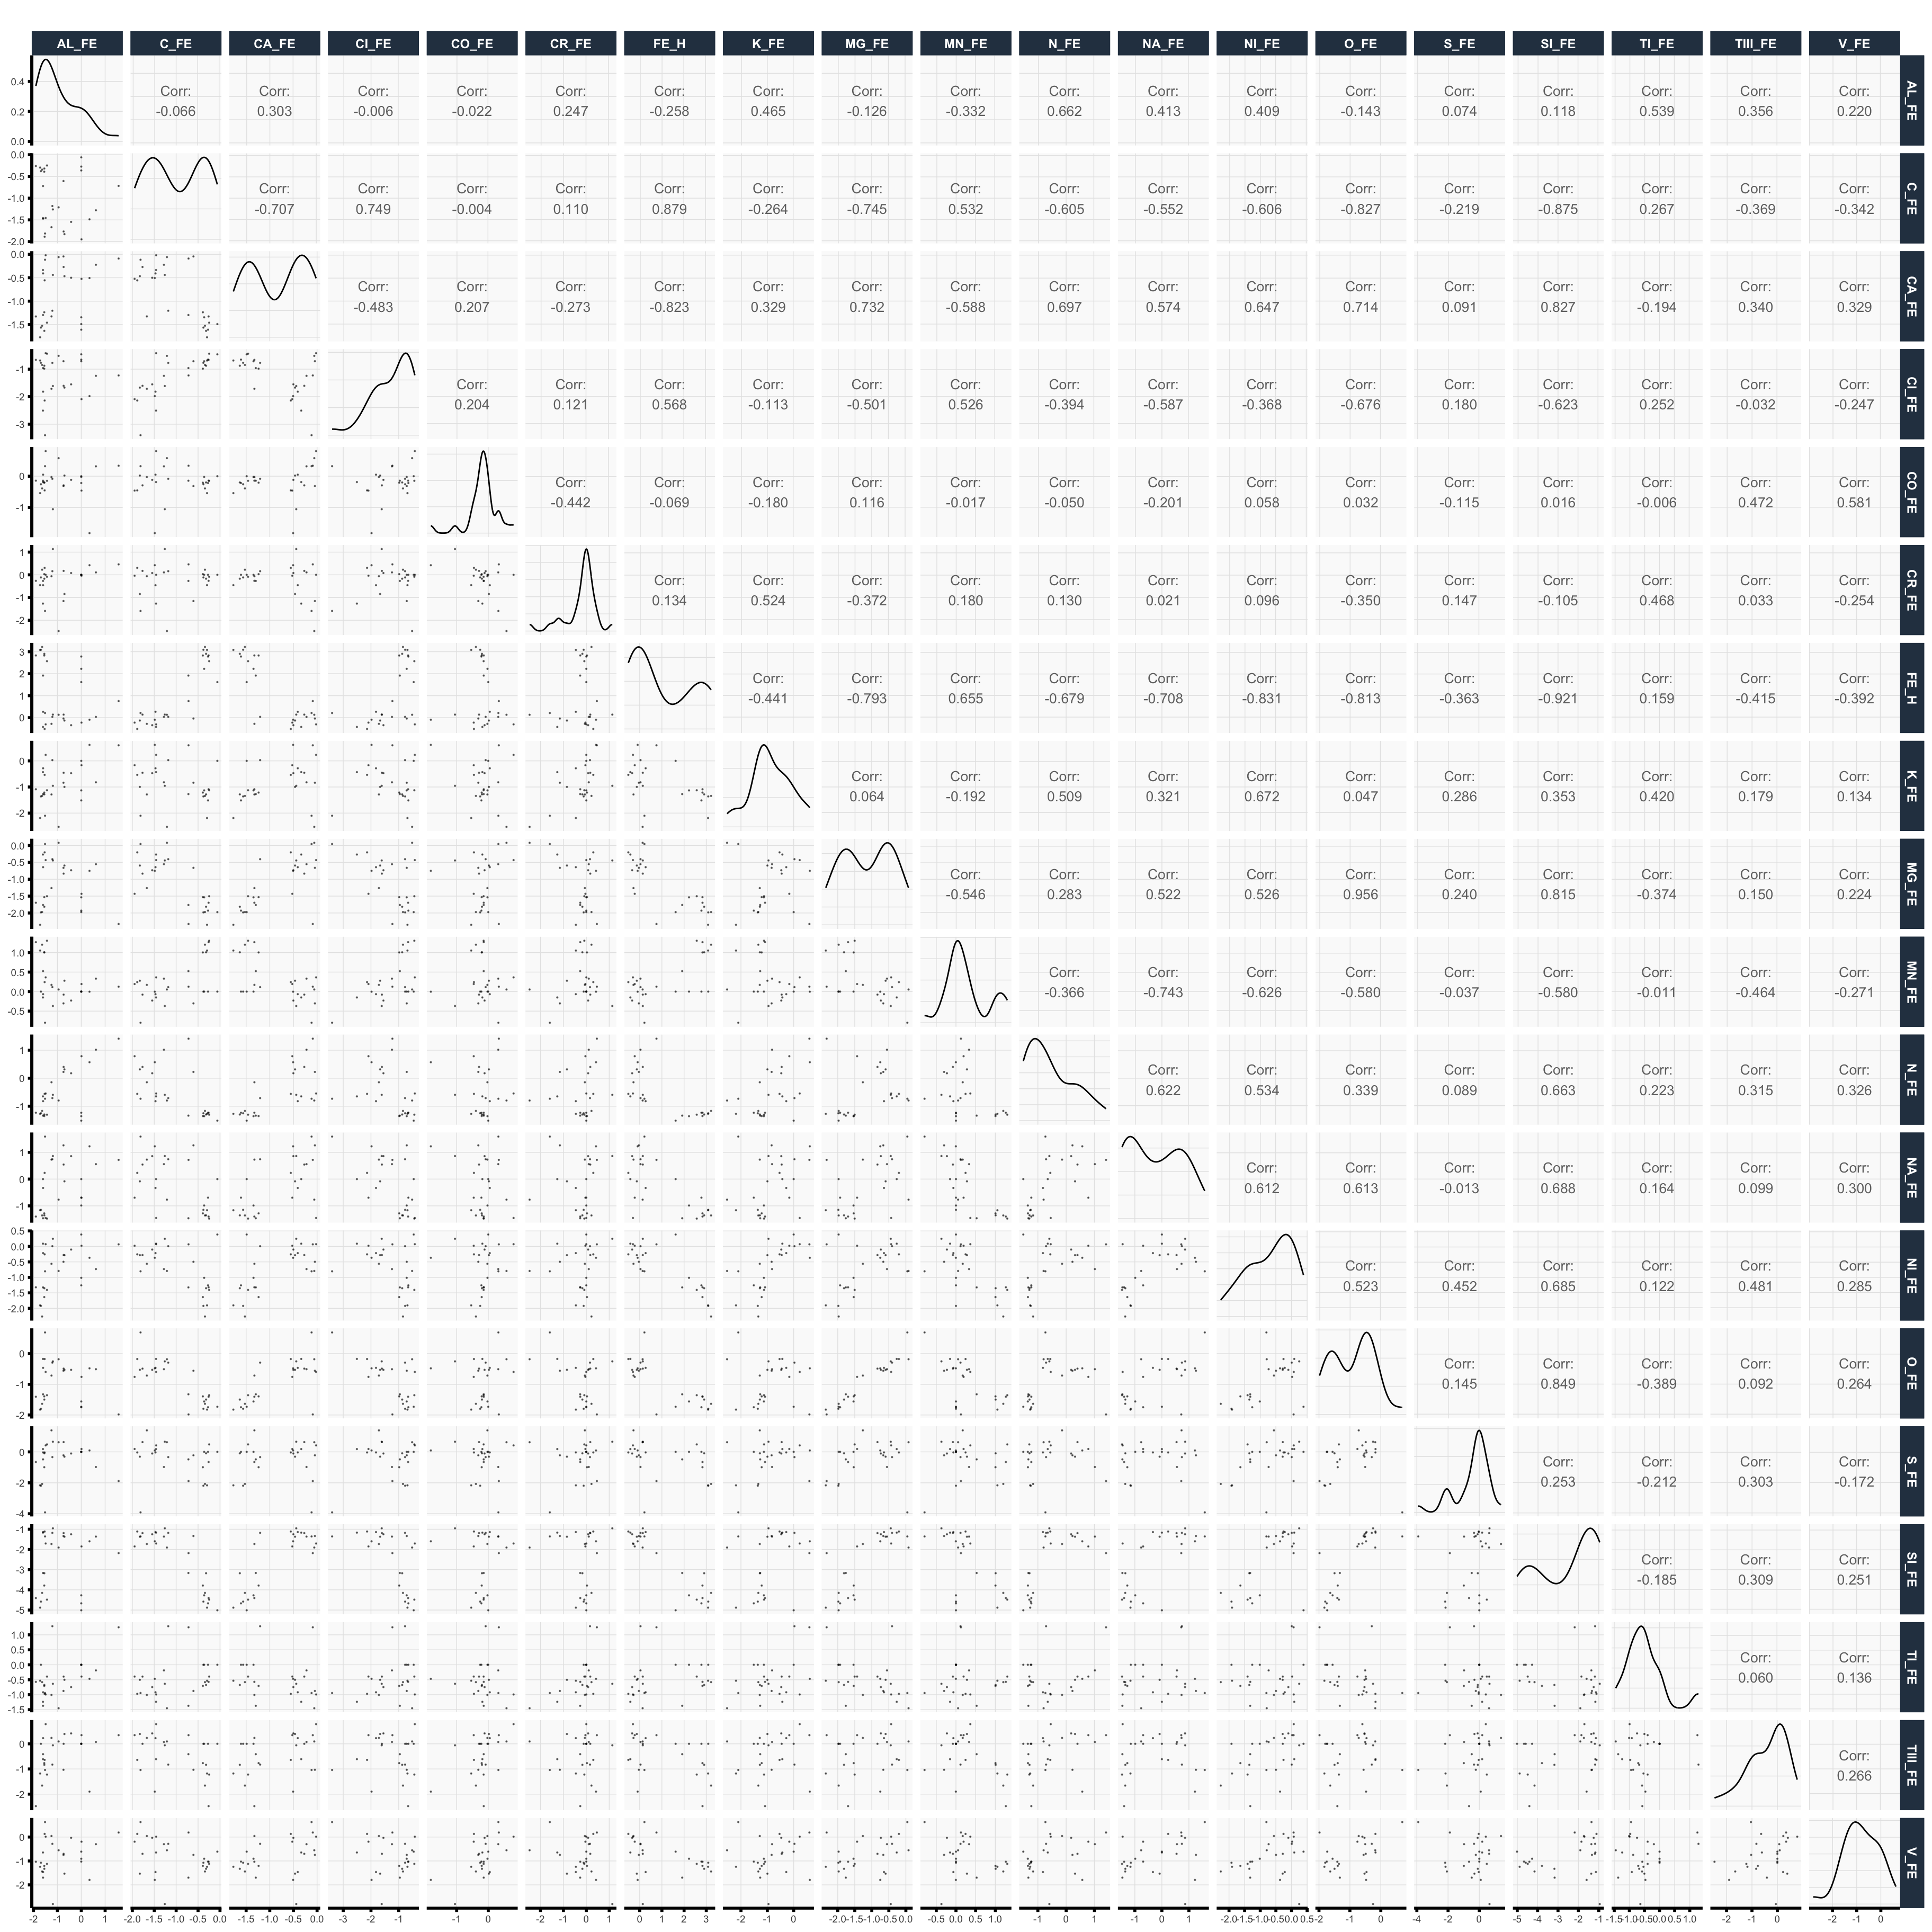
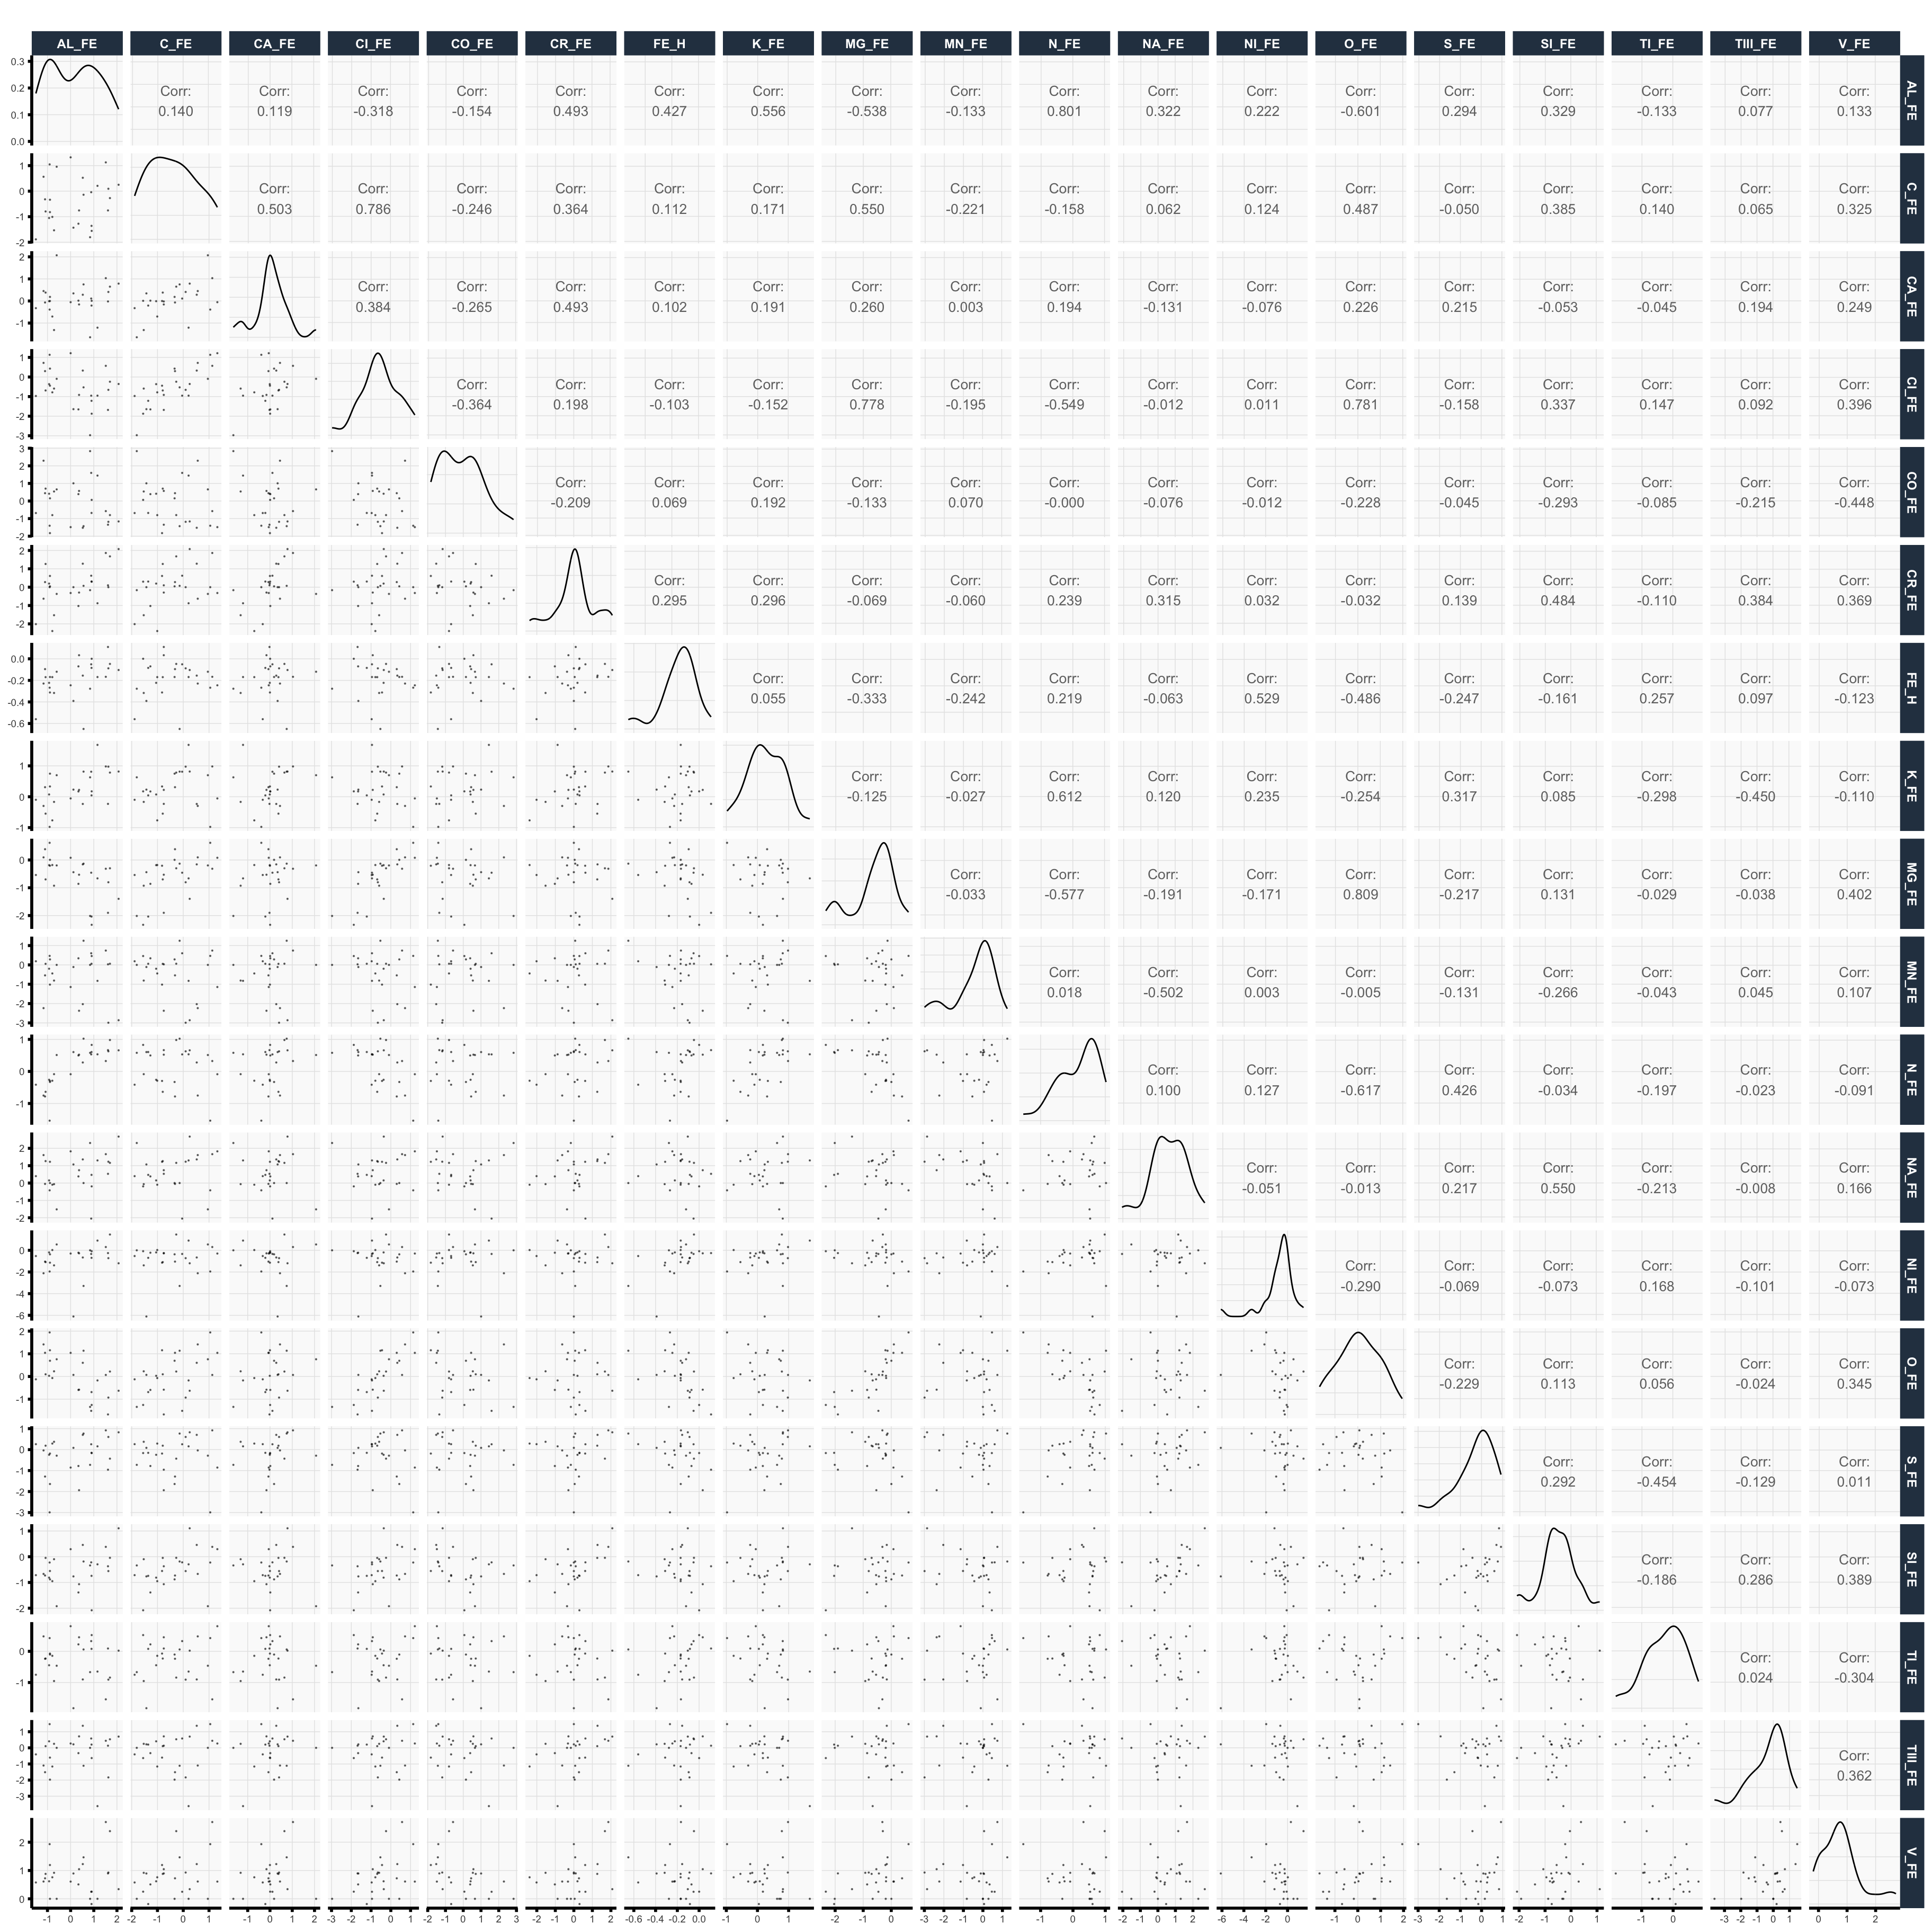
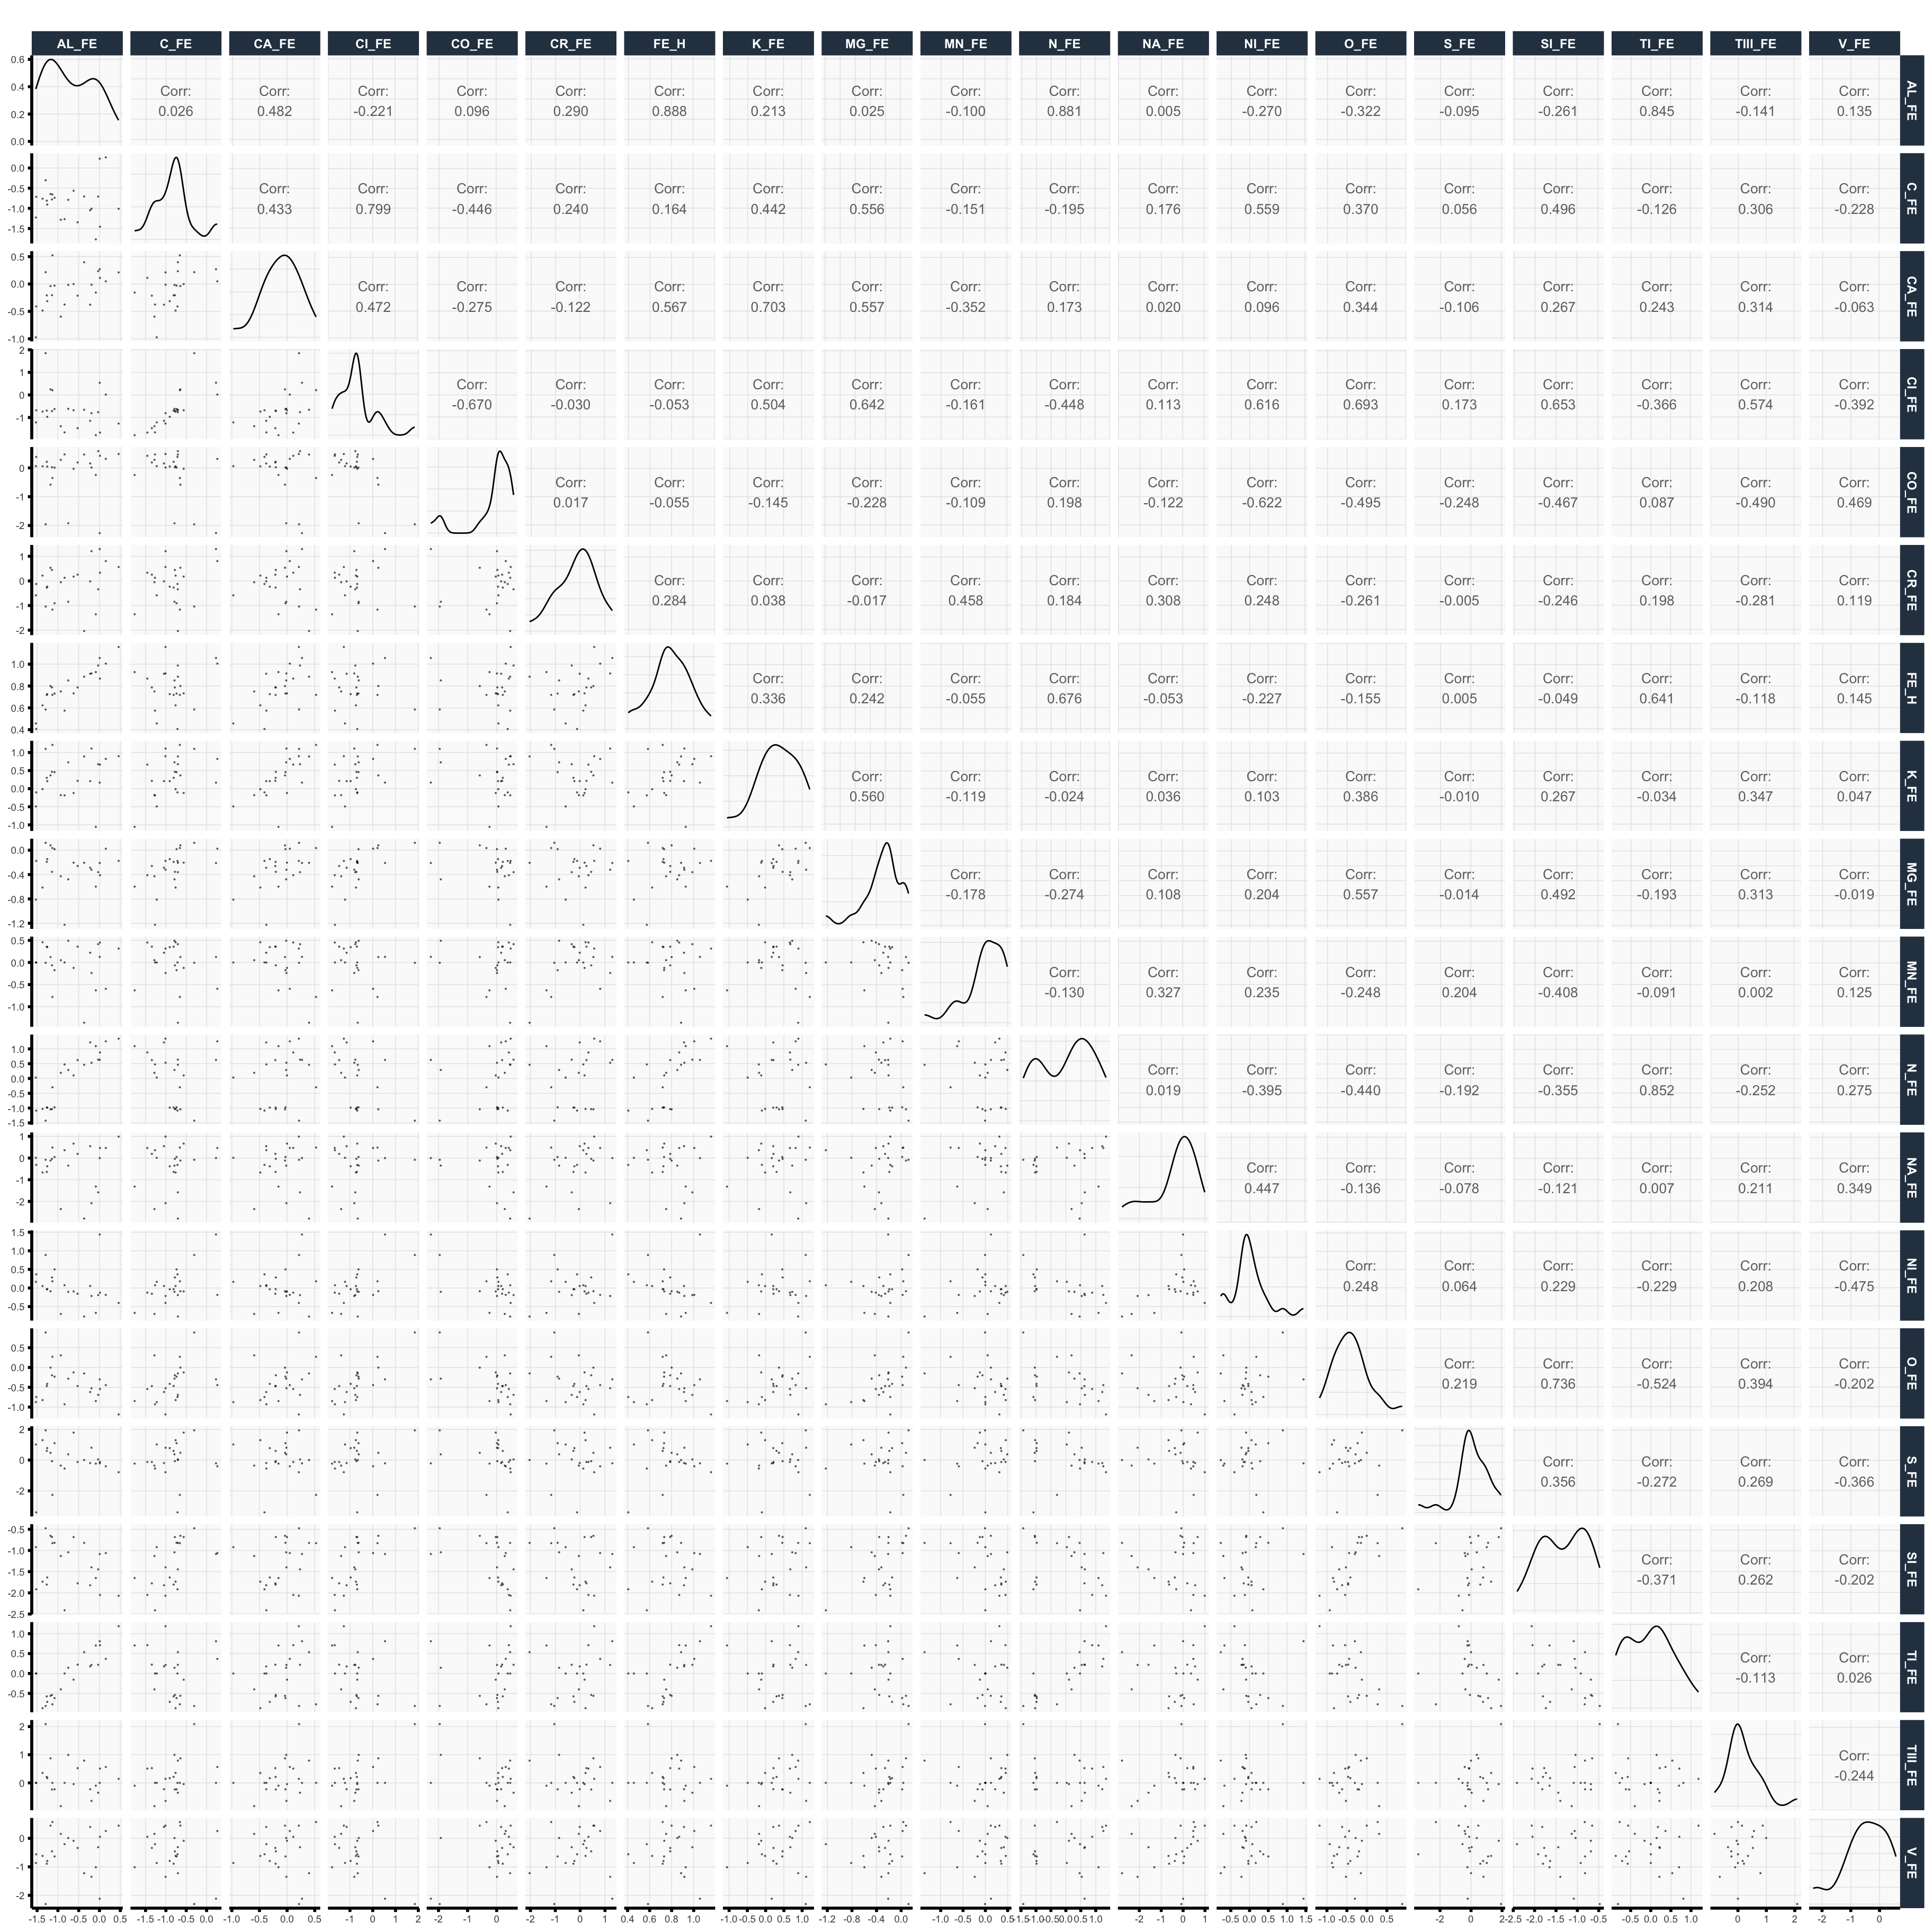
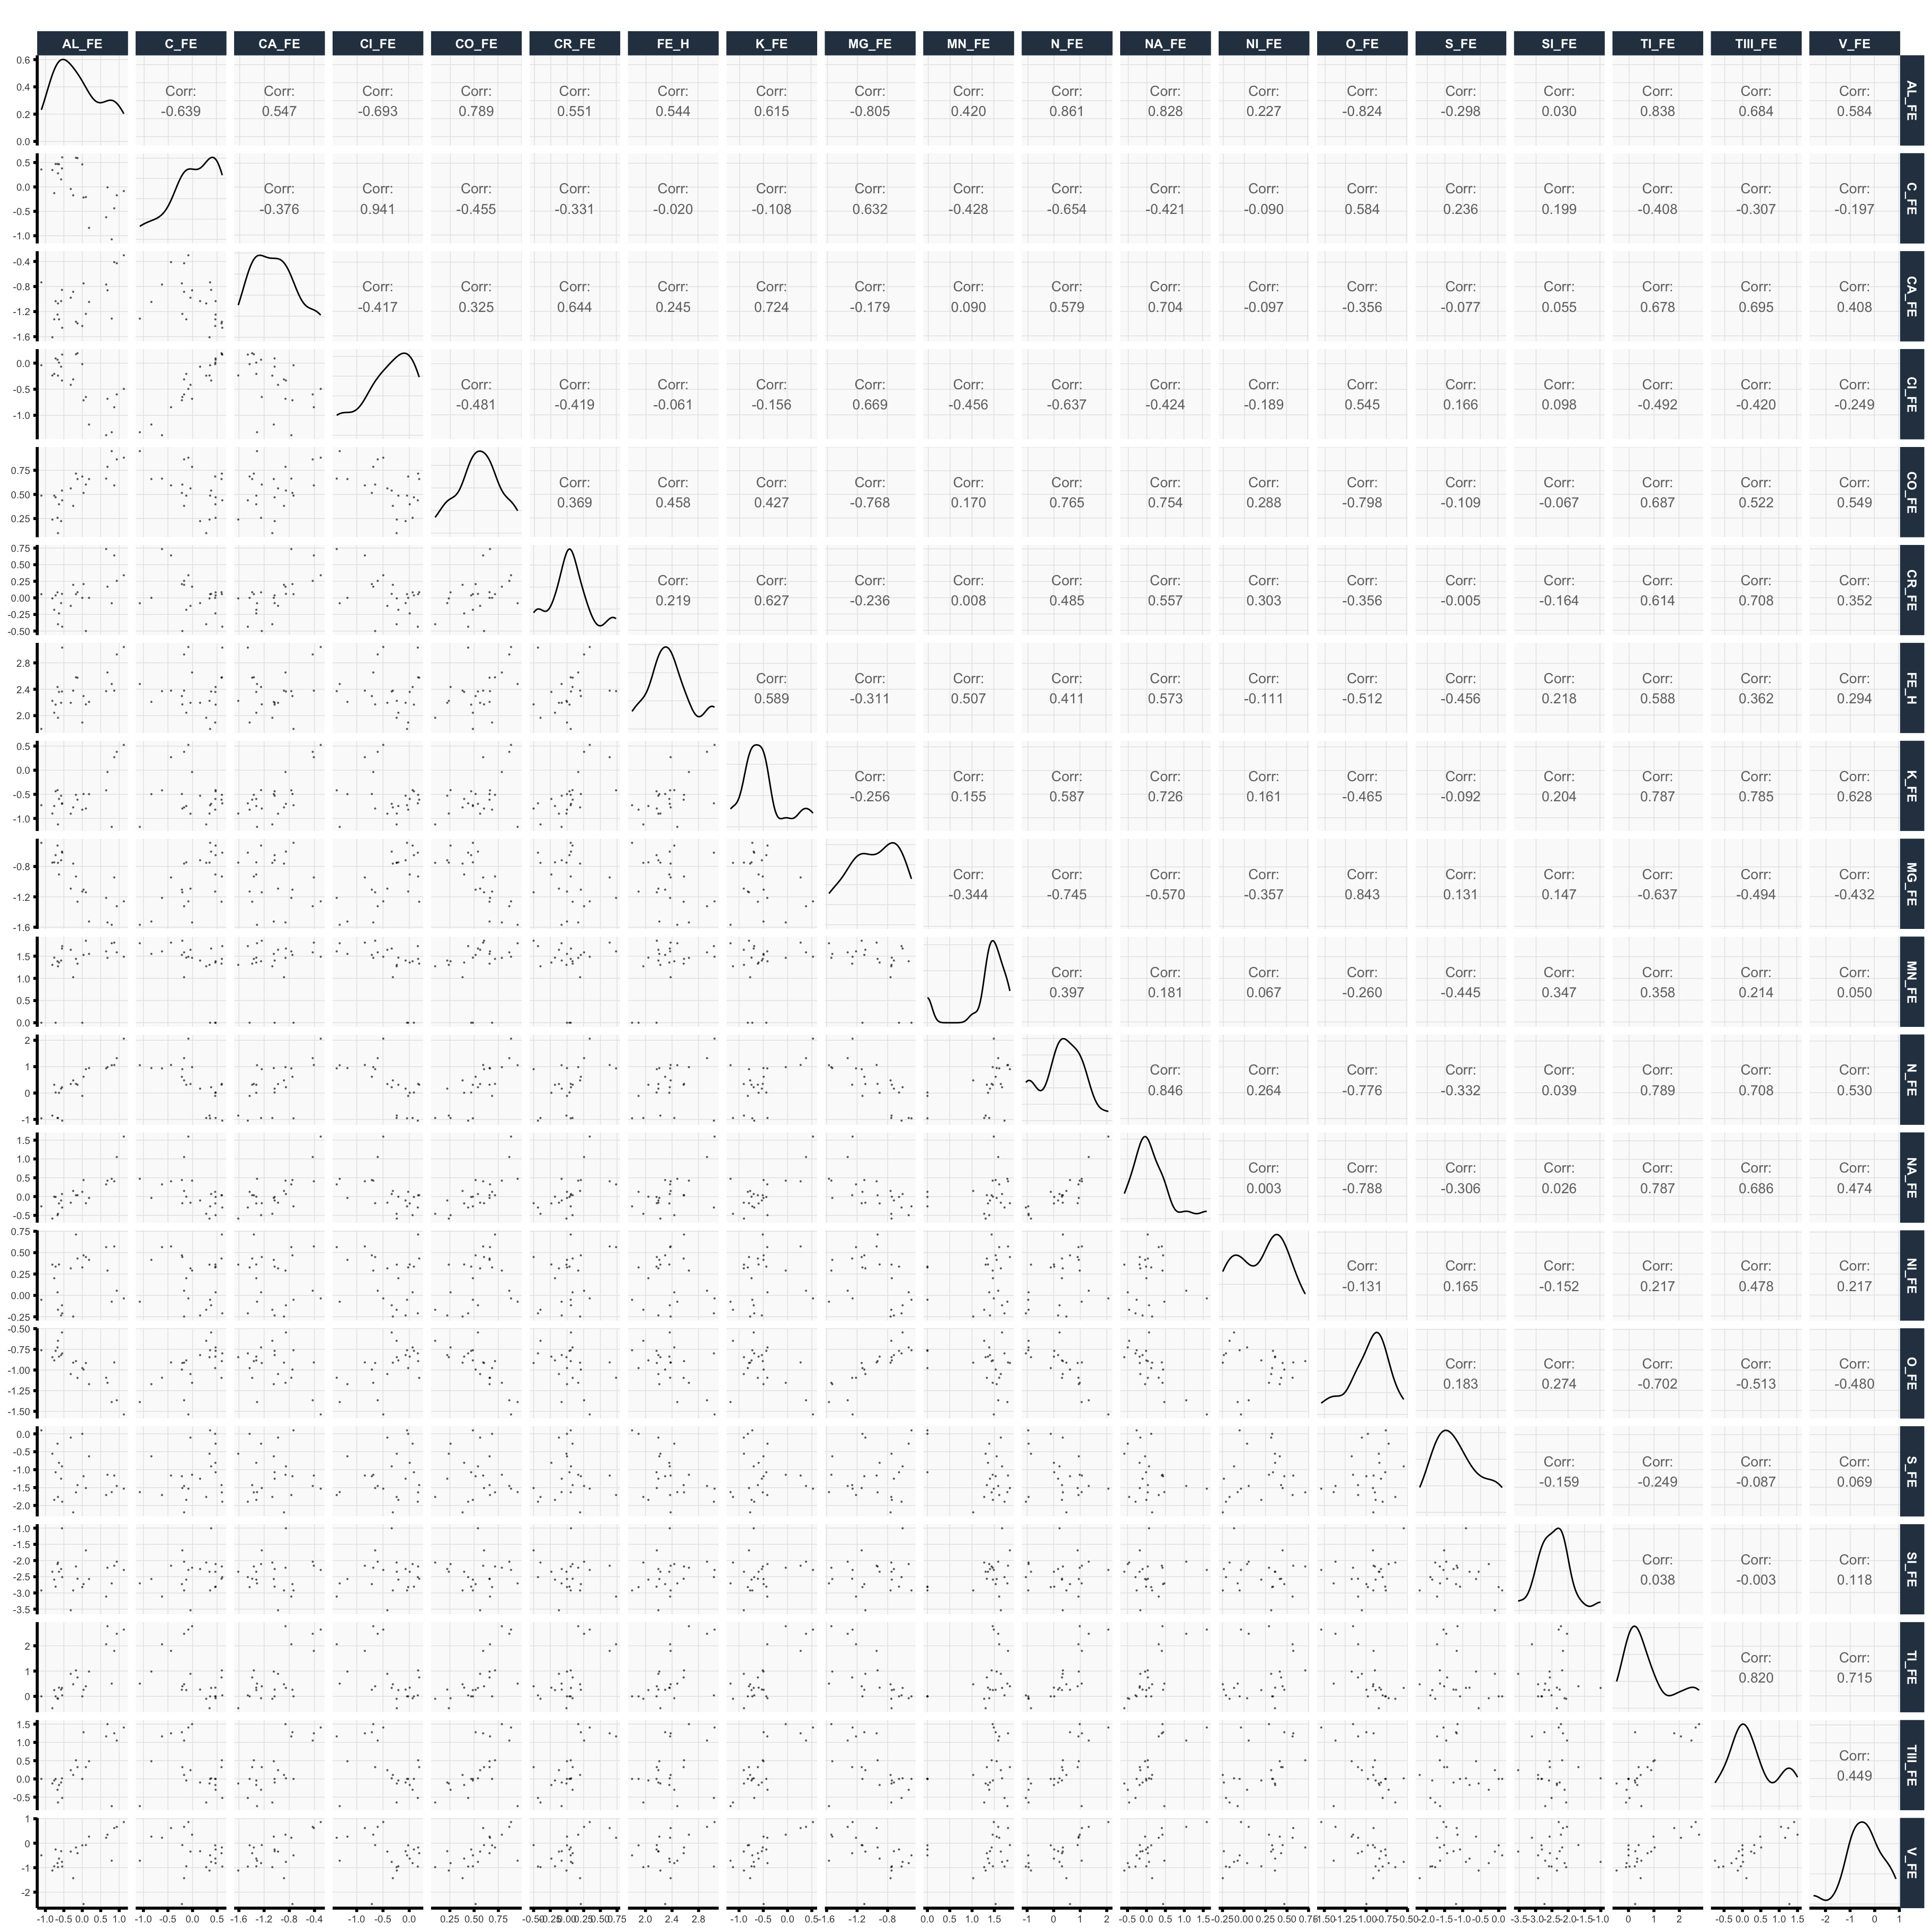
Exploratory Data Analysis
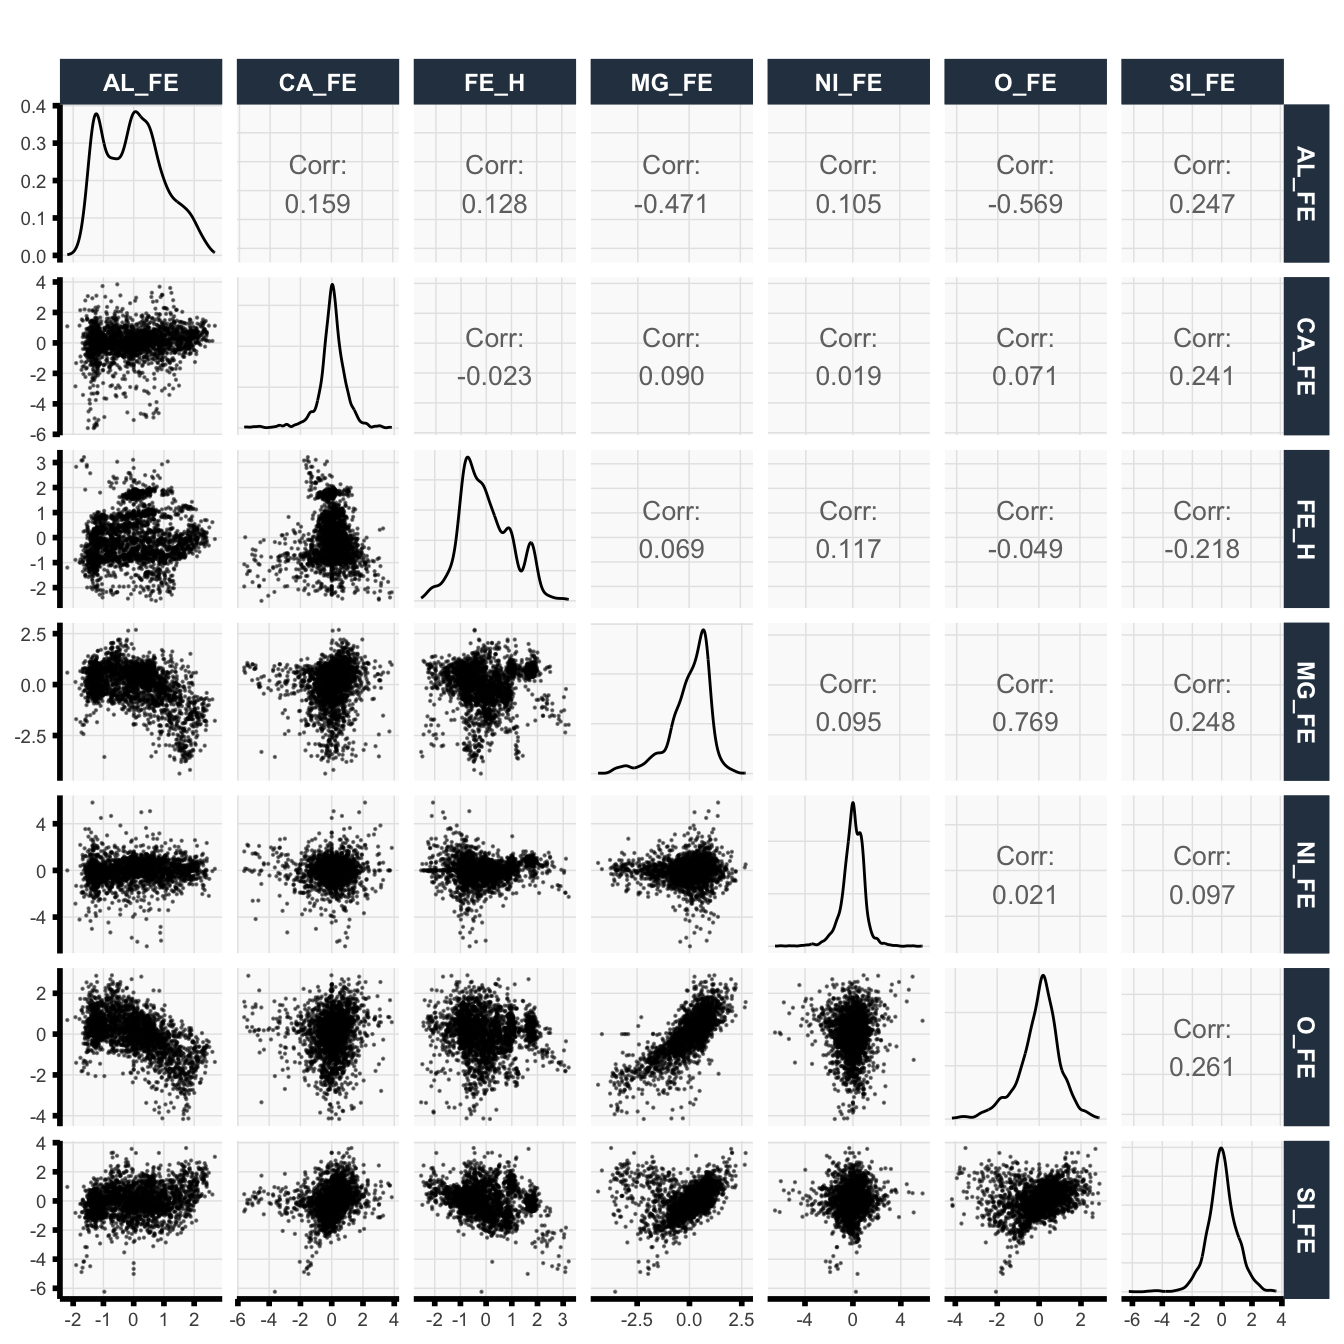
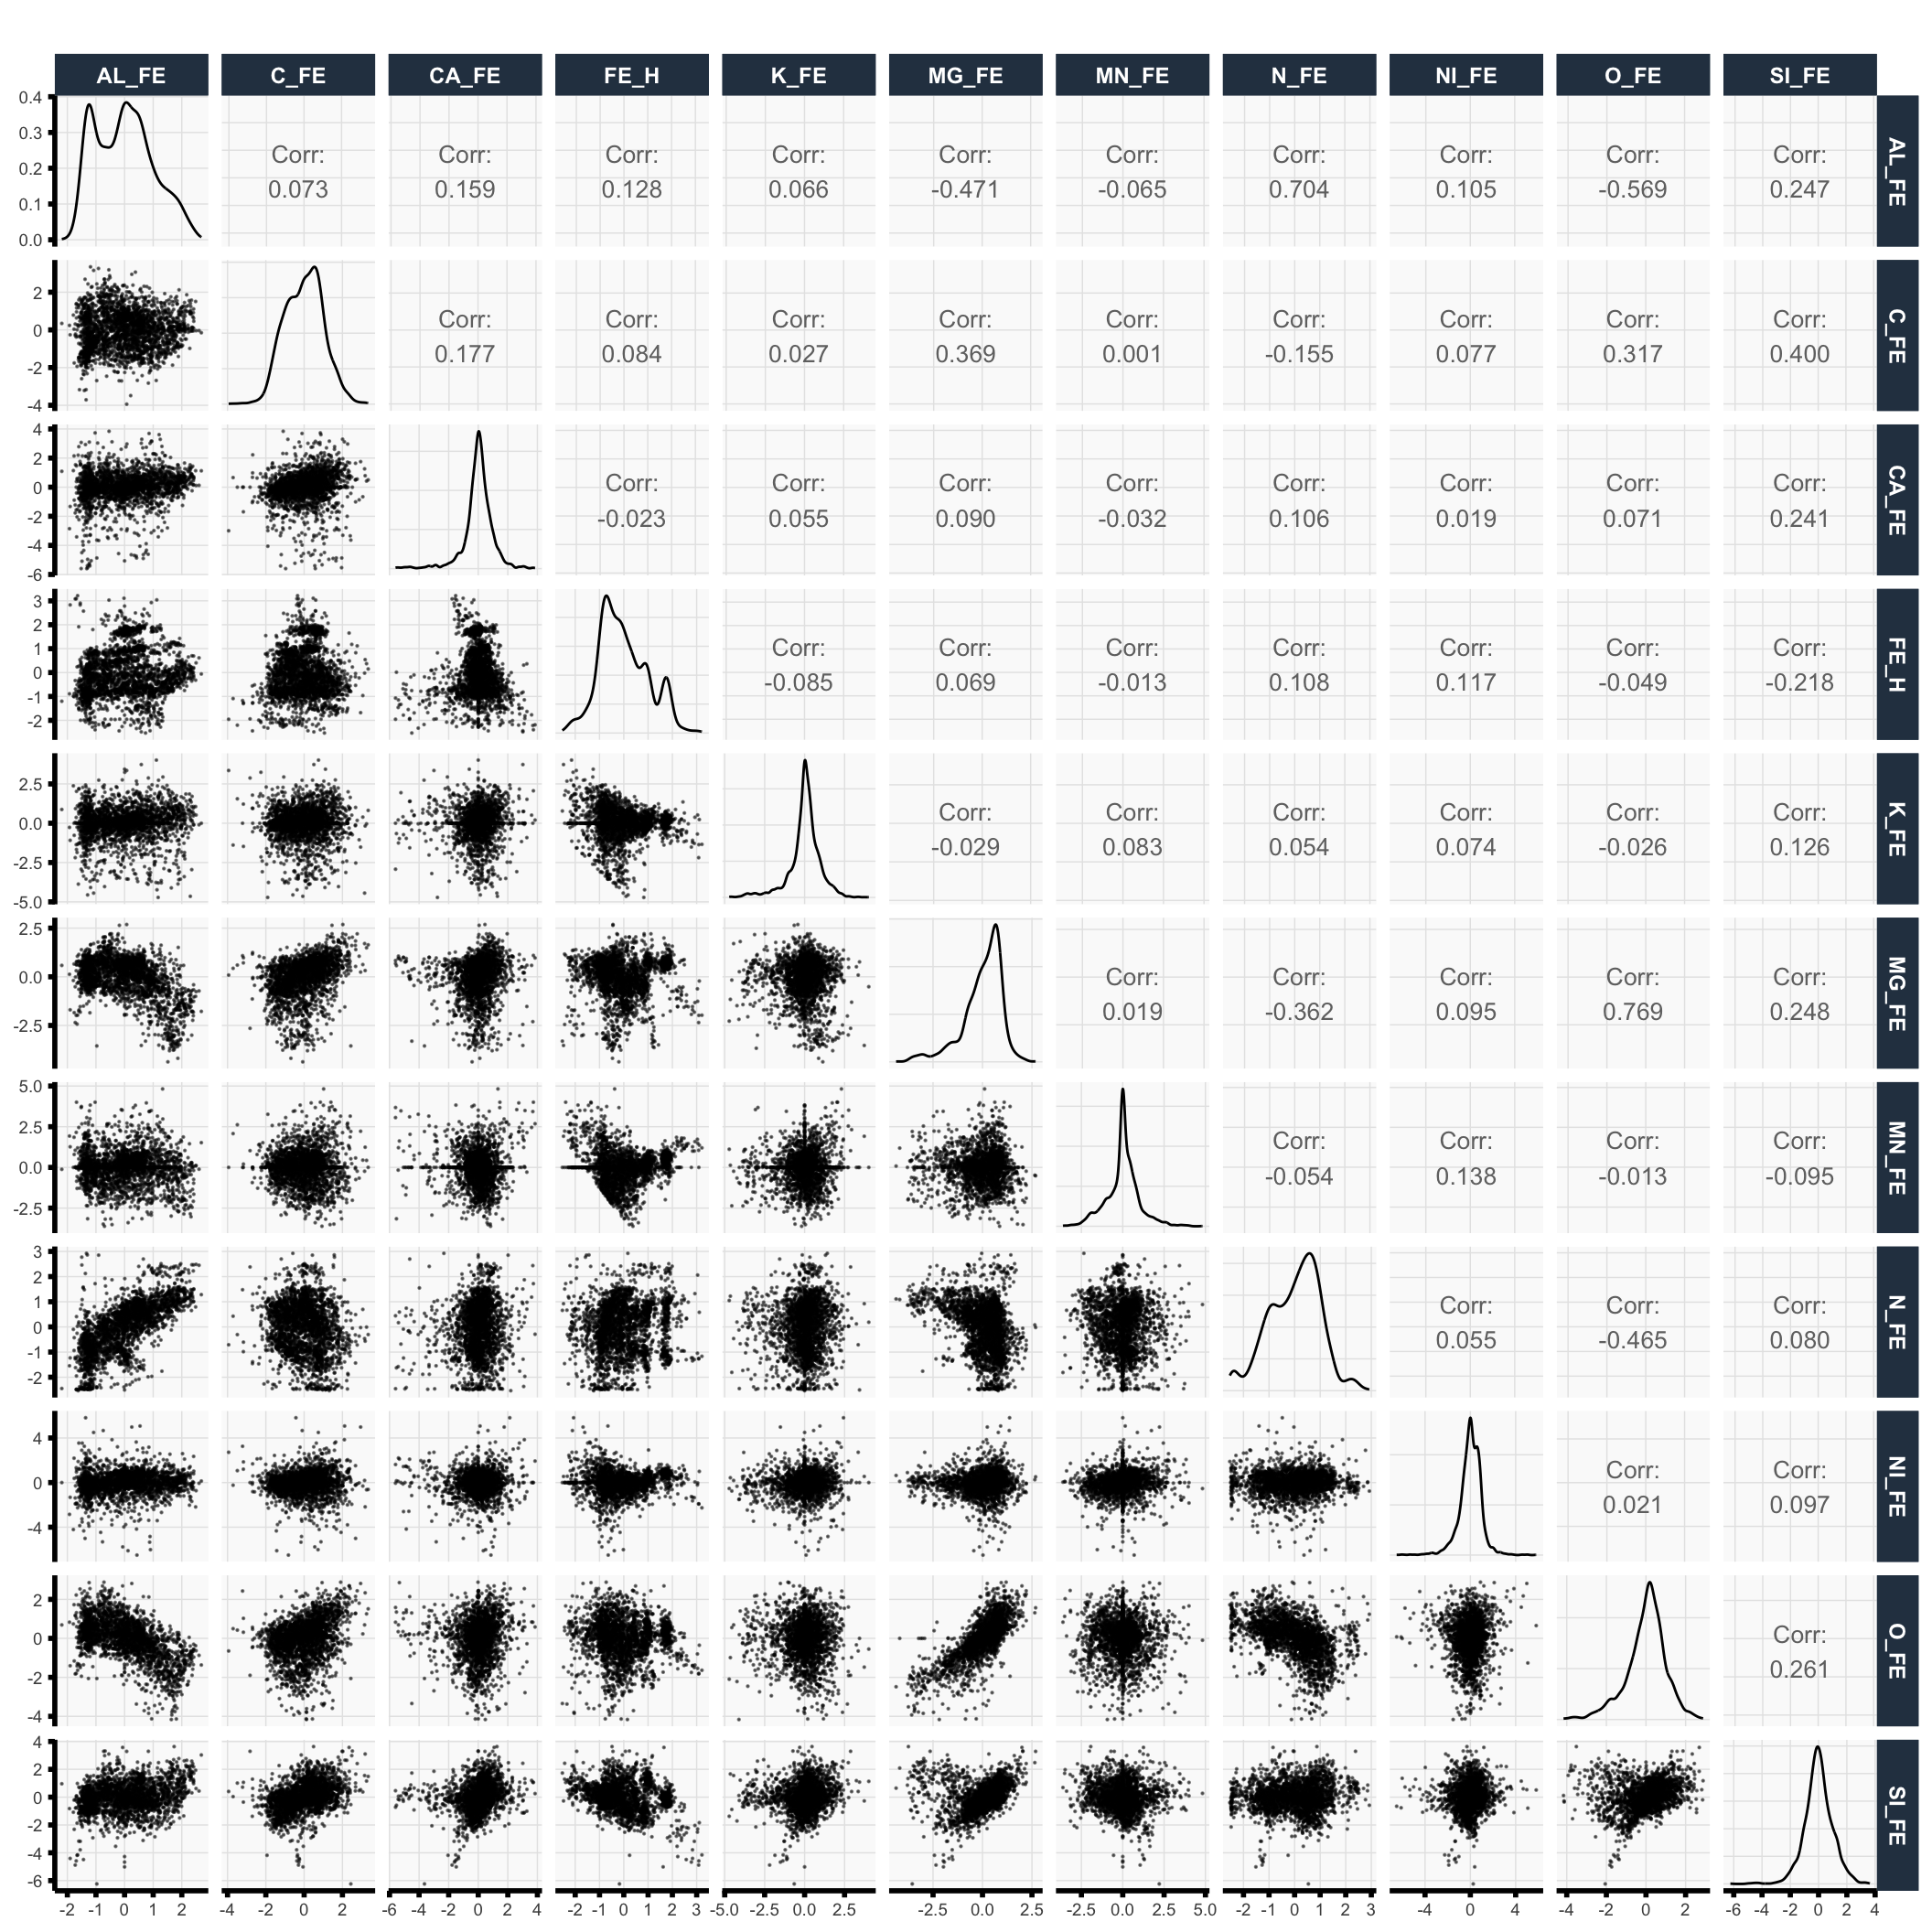
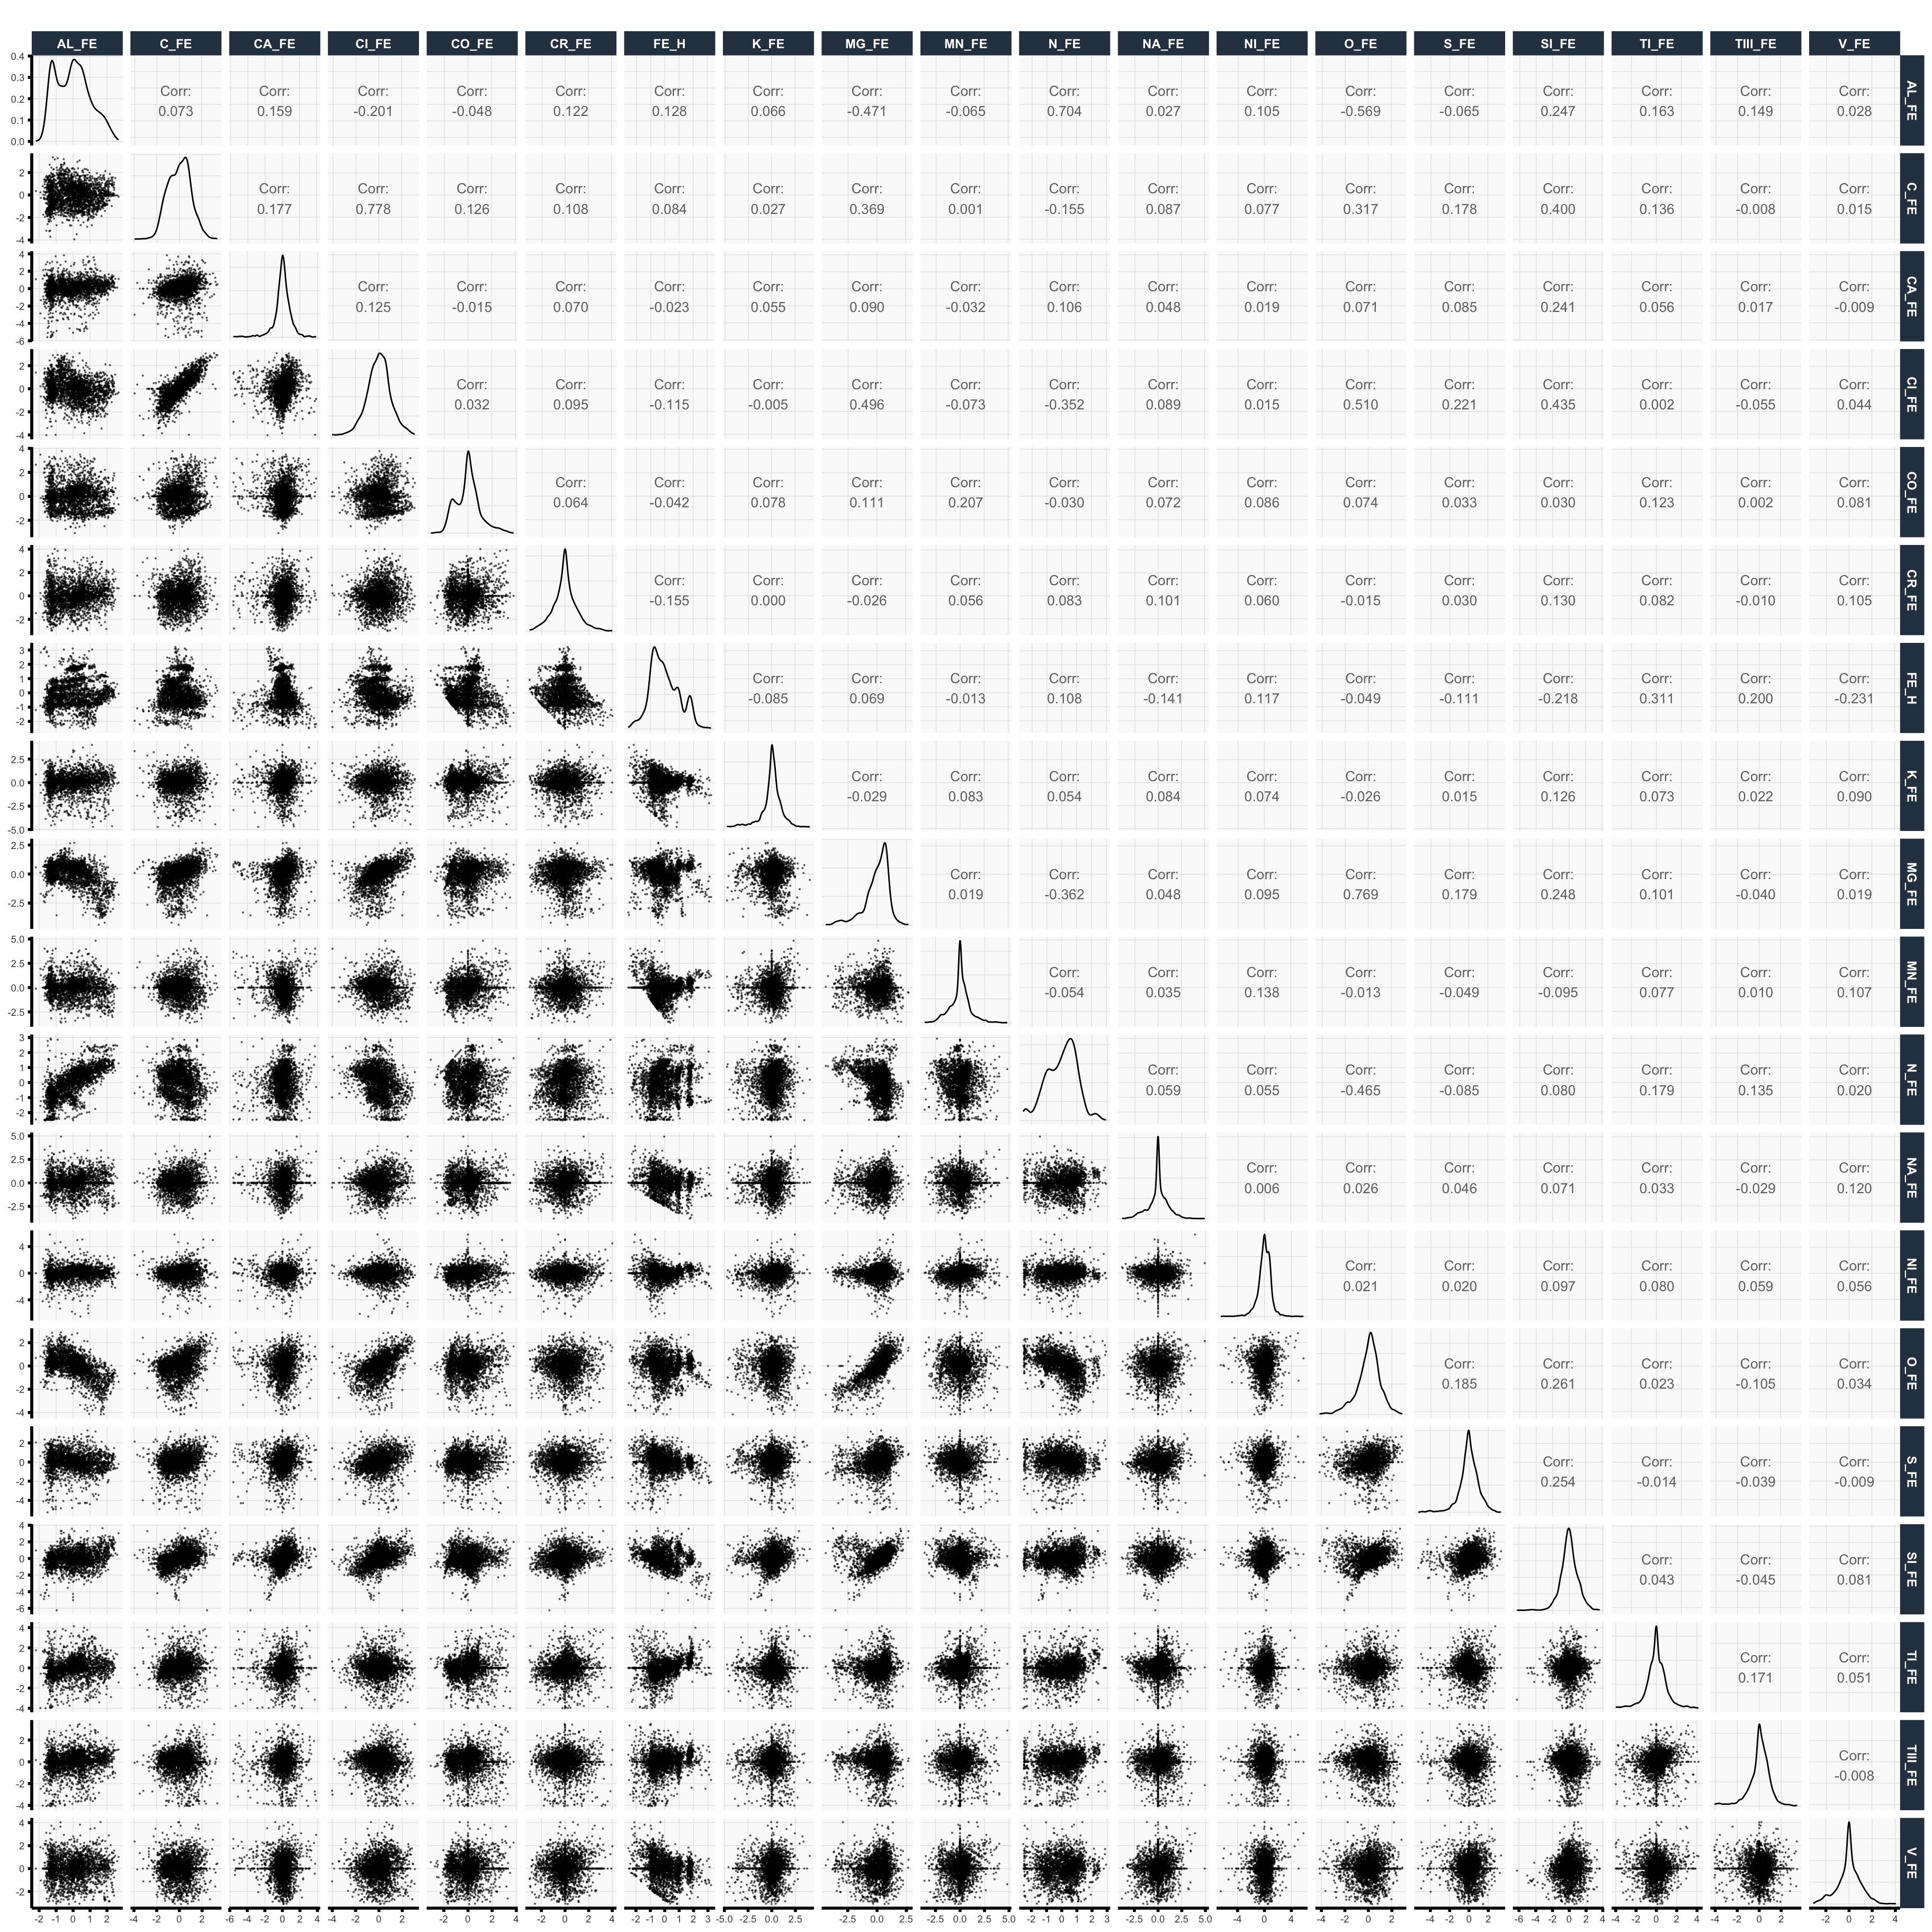
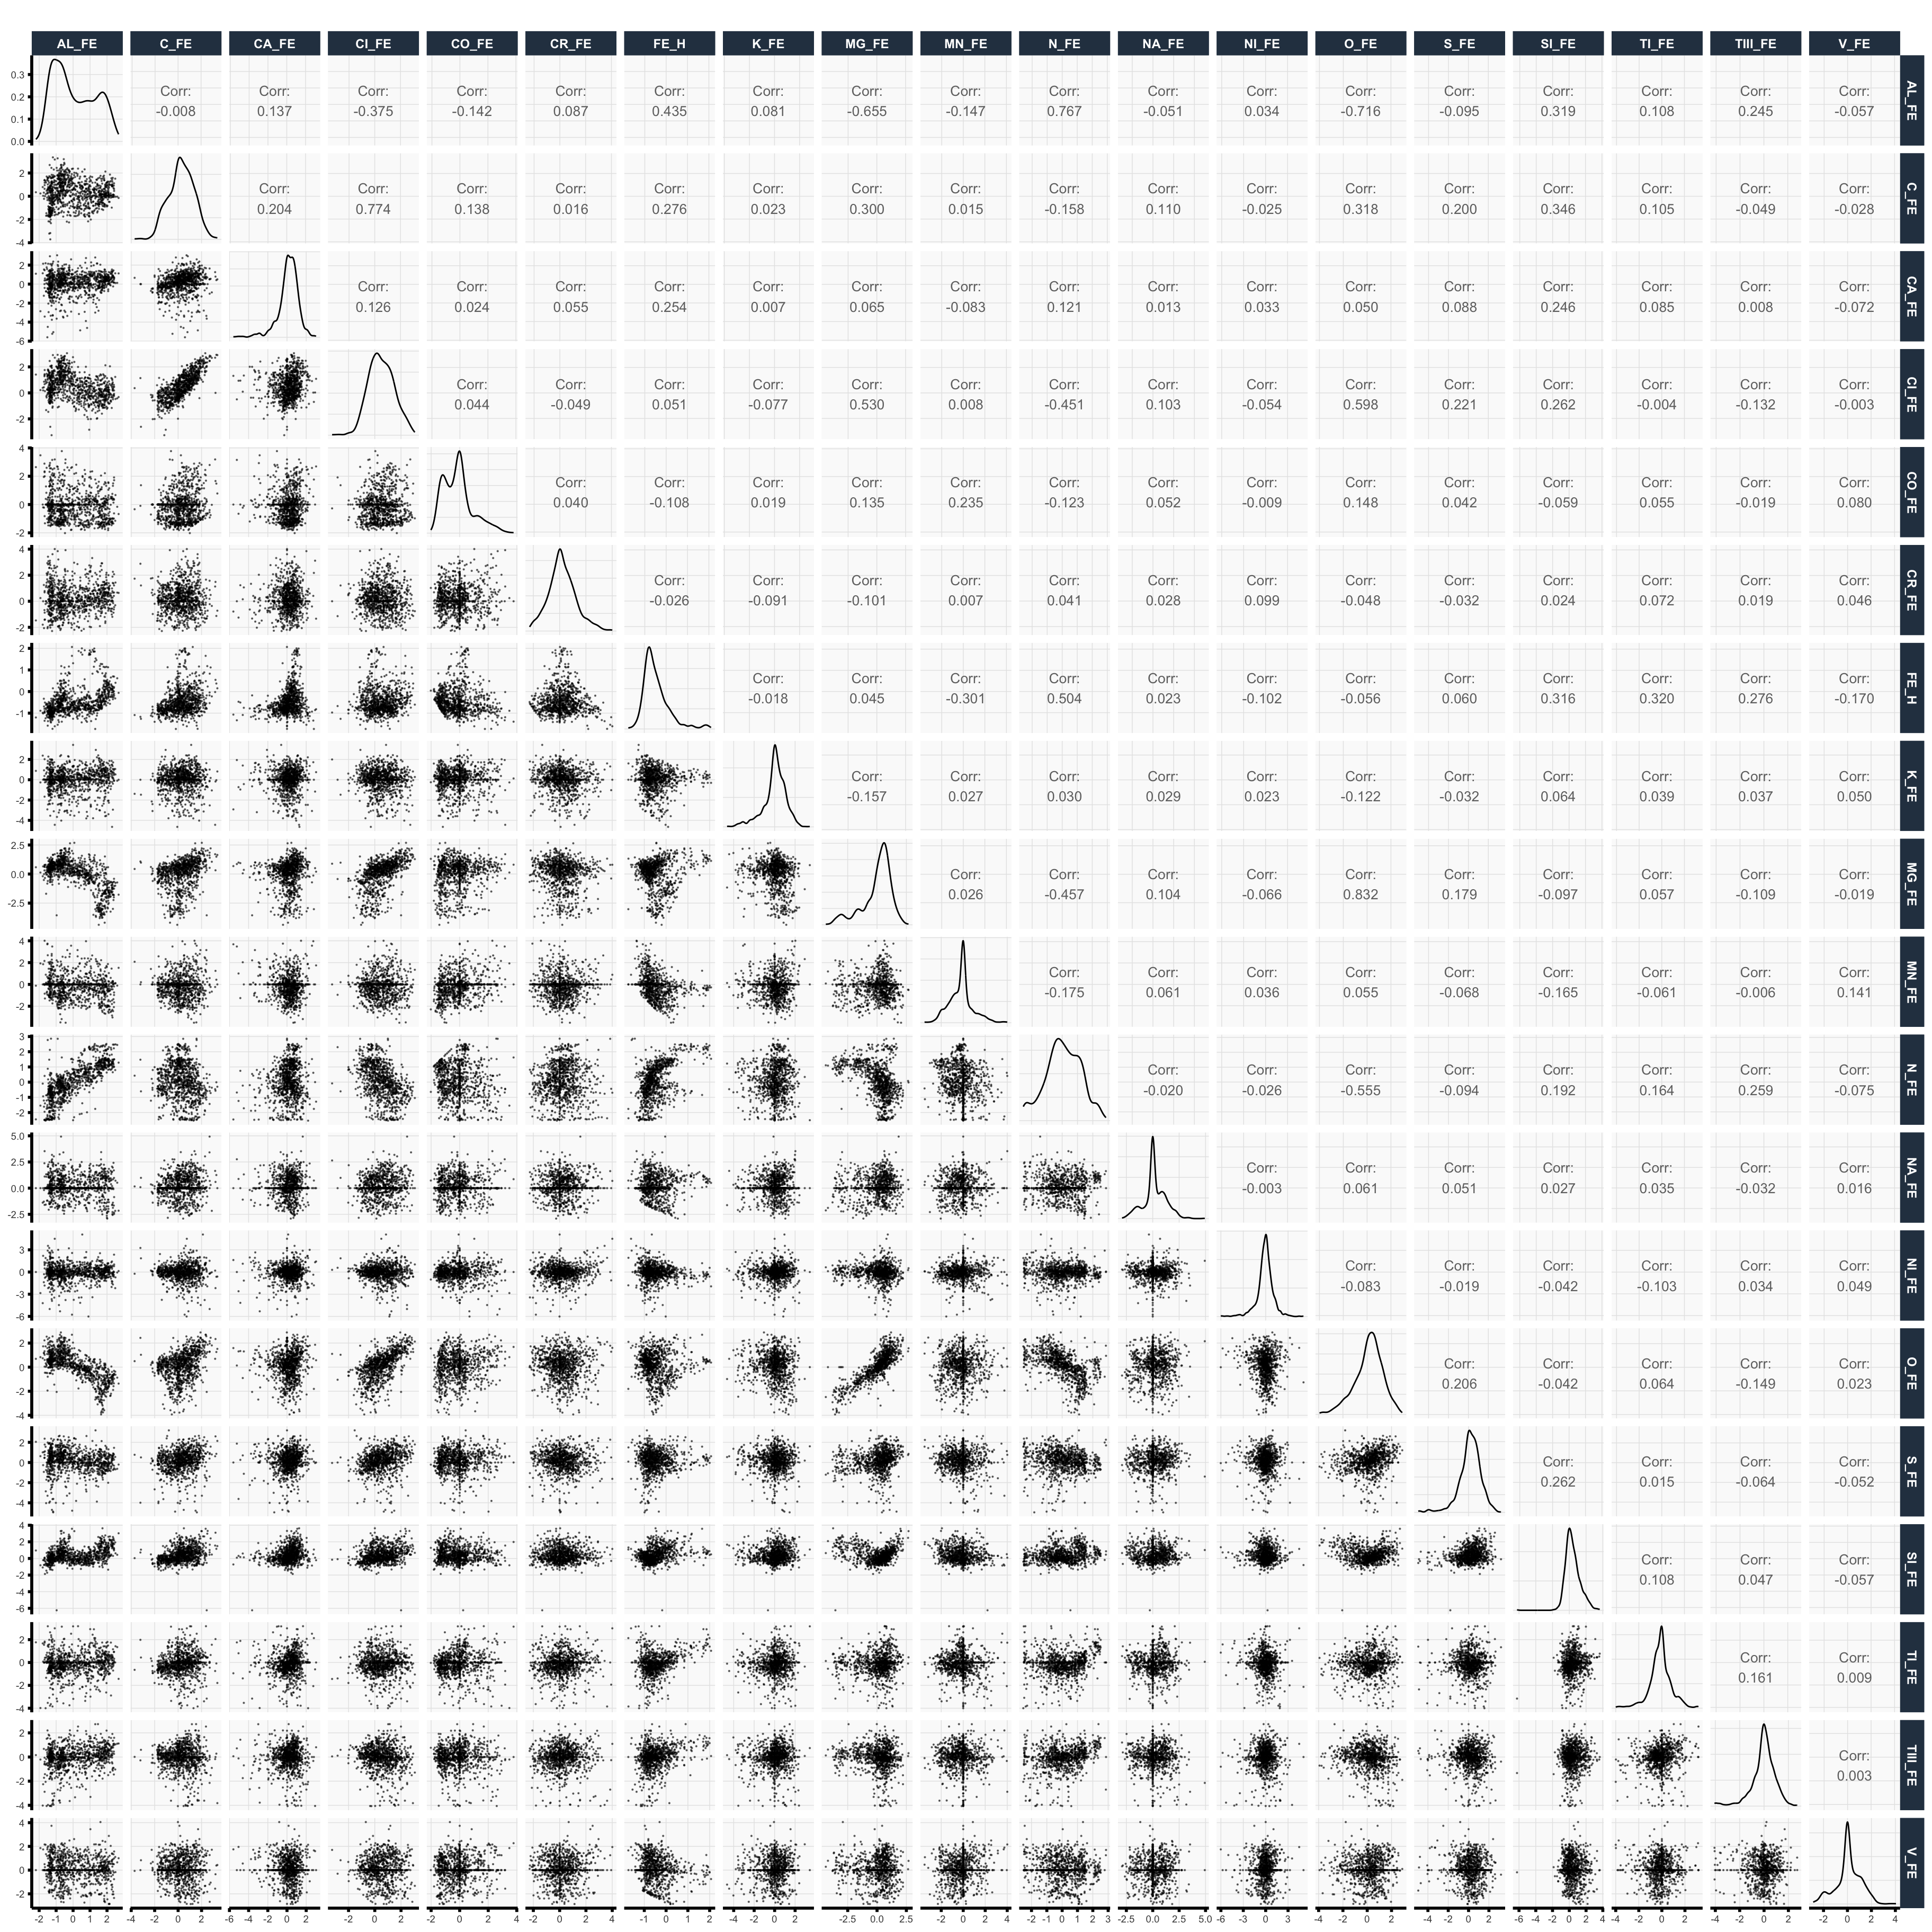
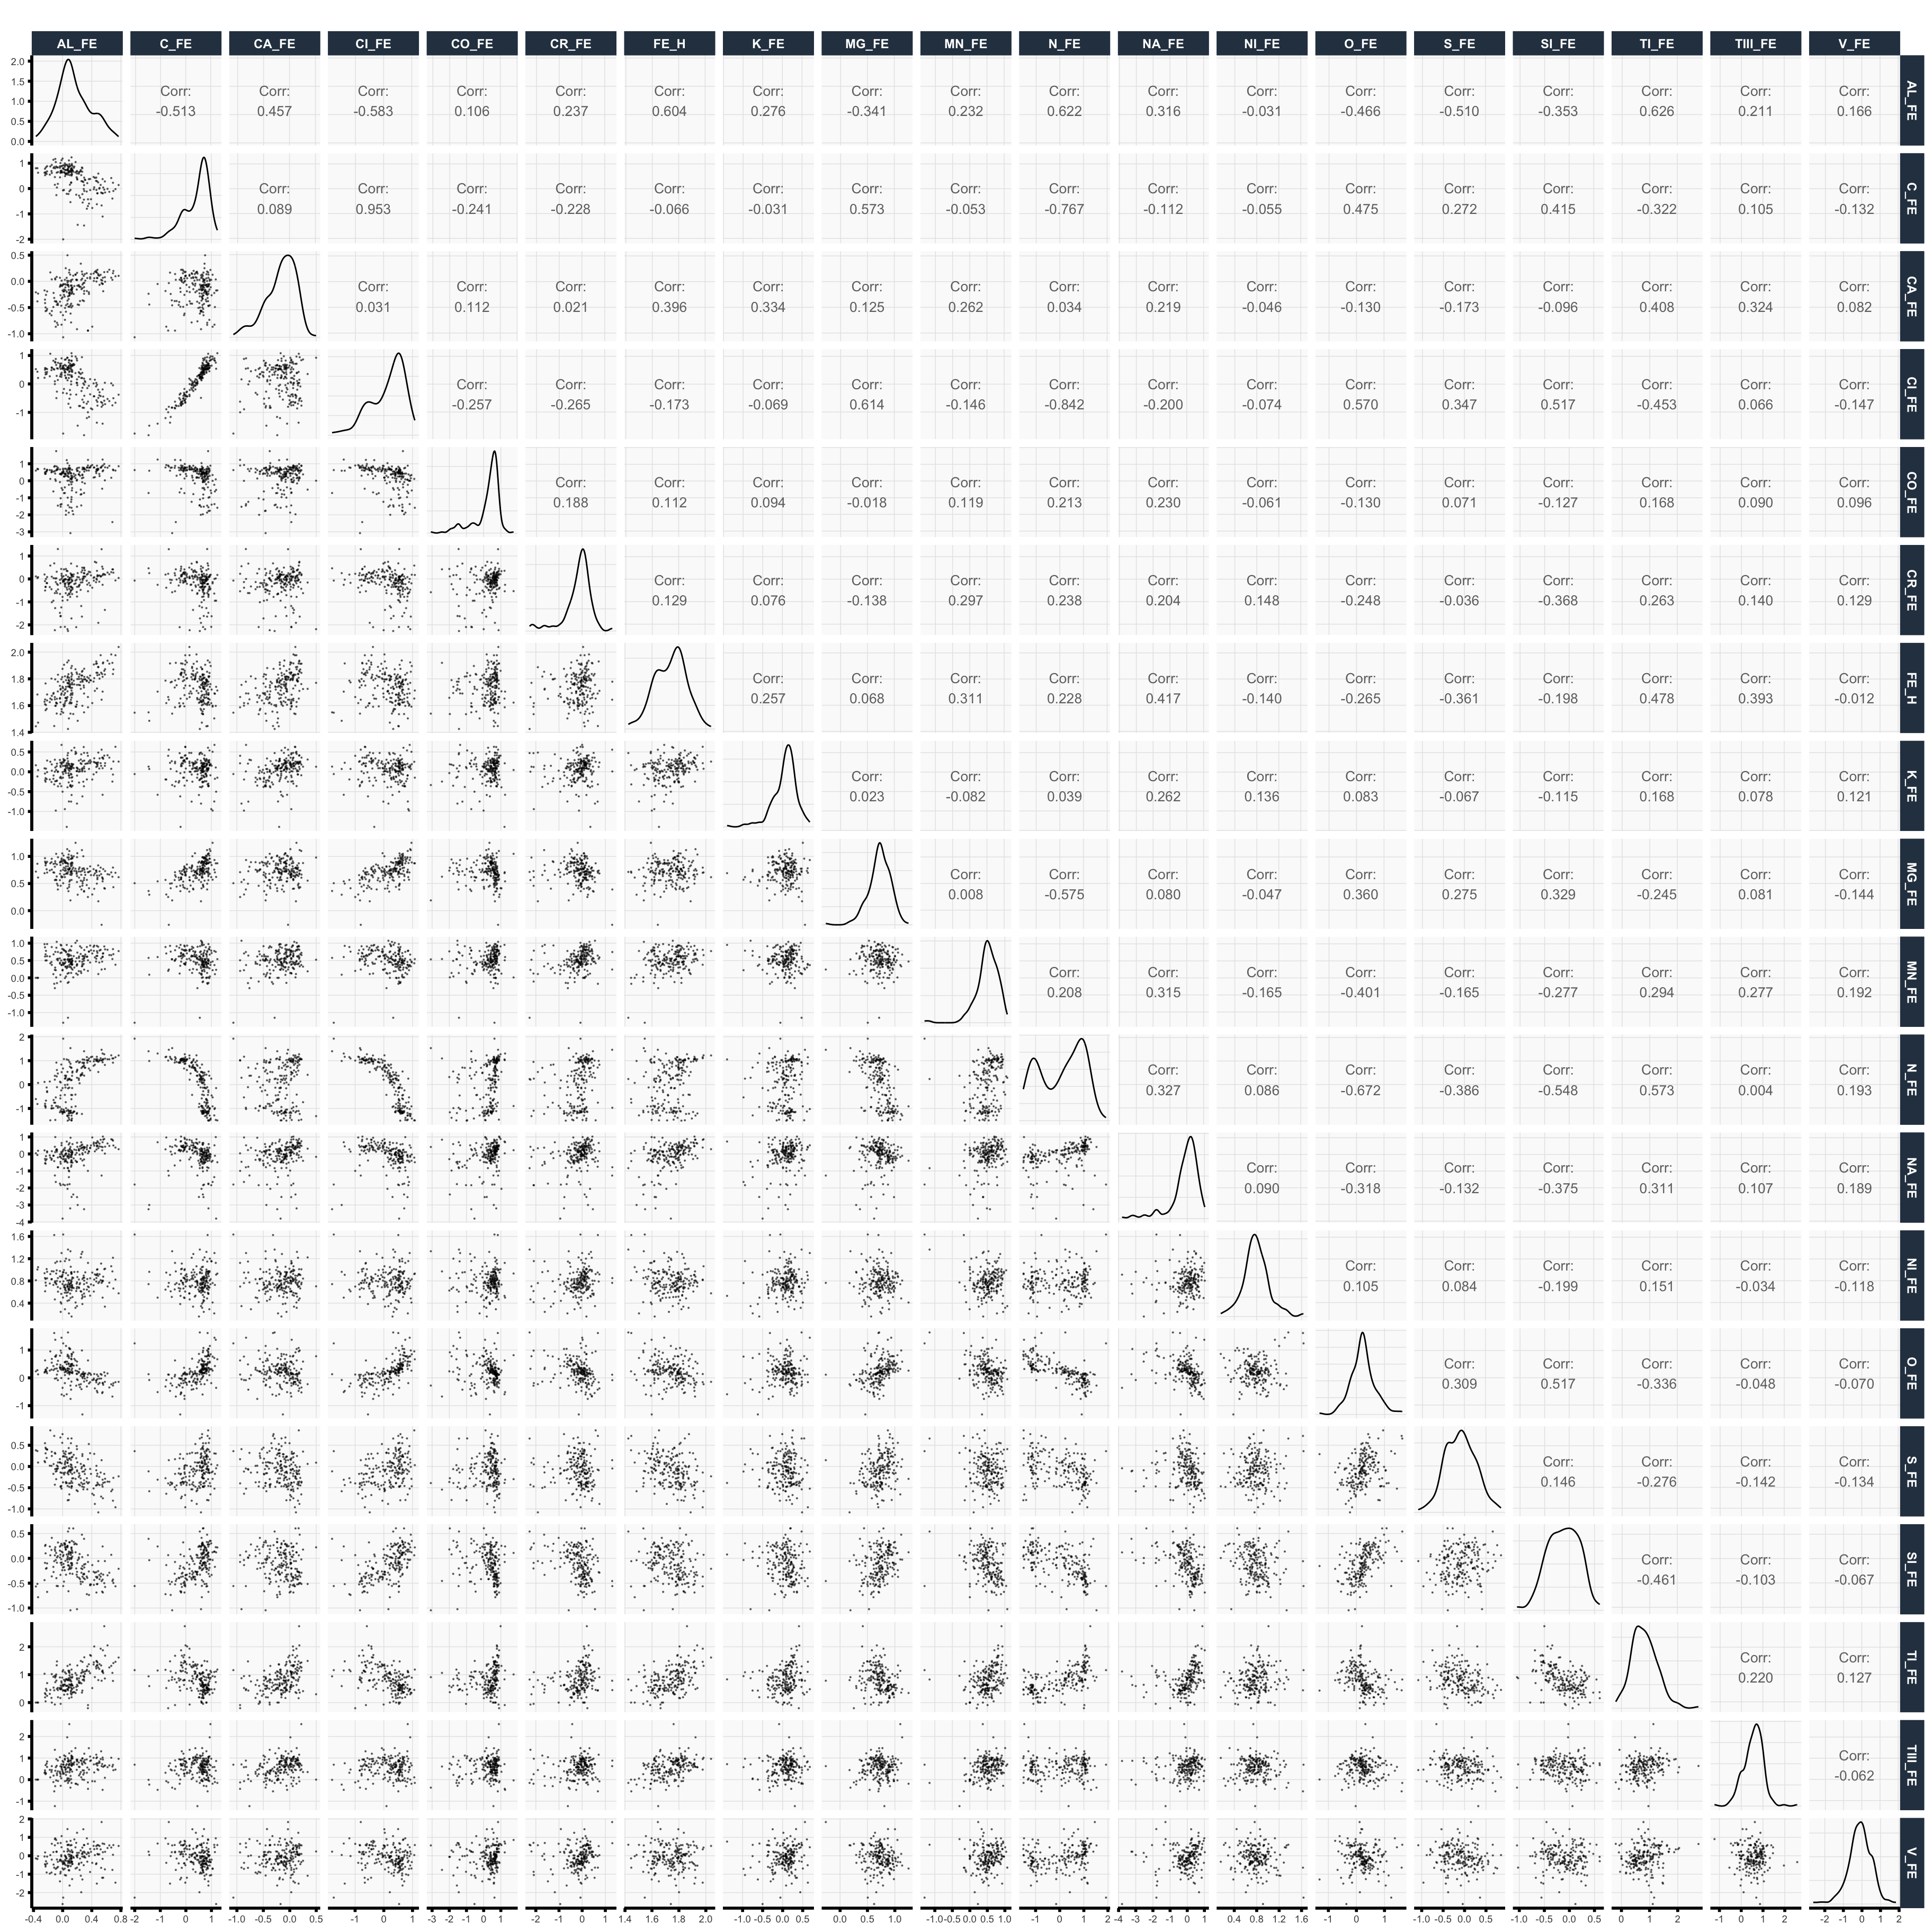
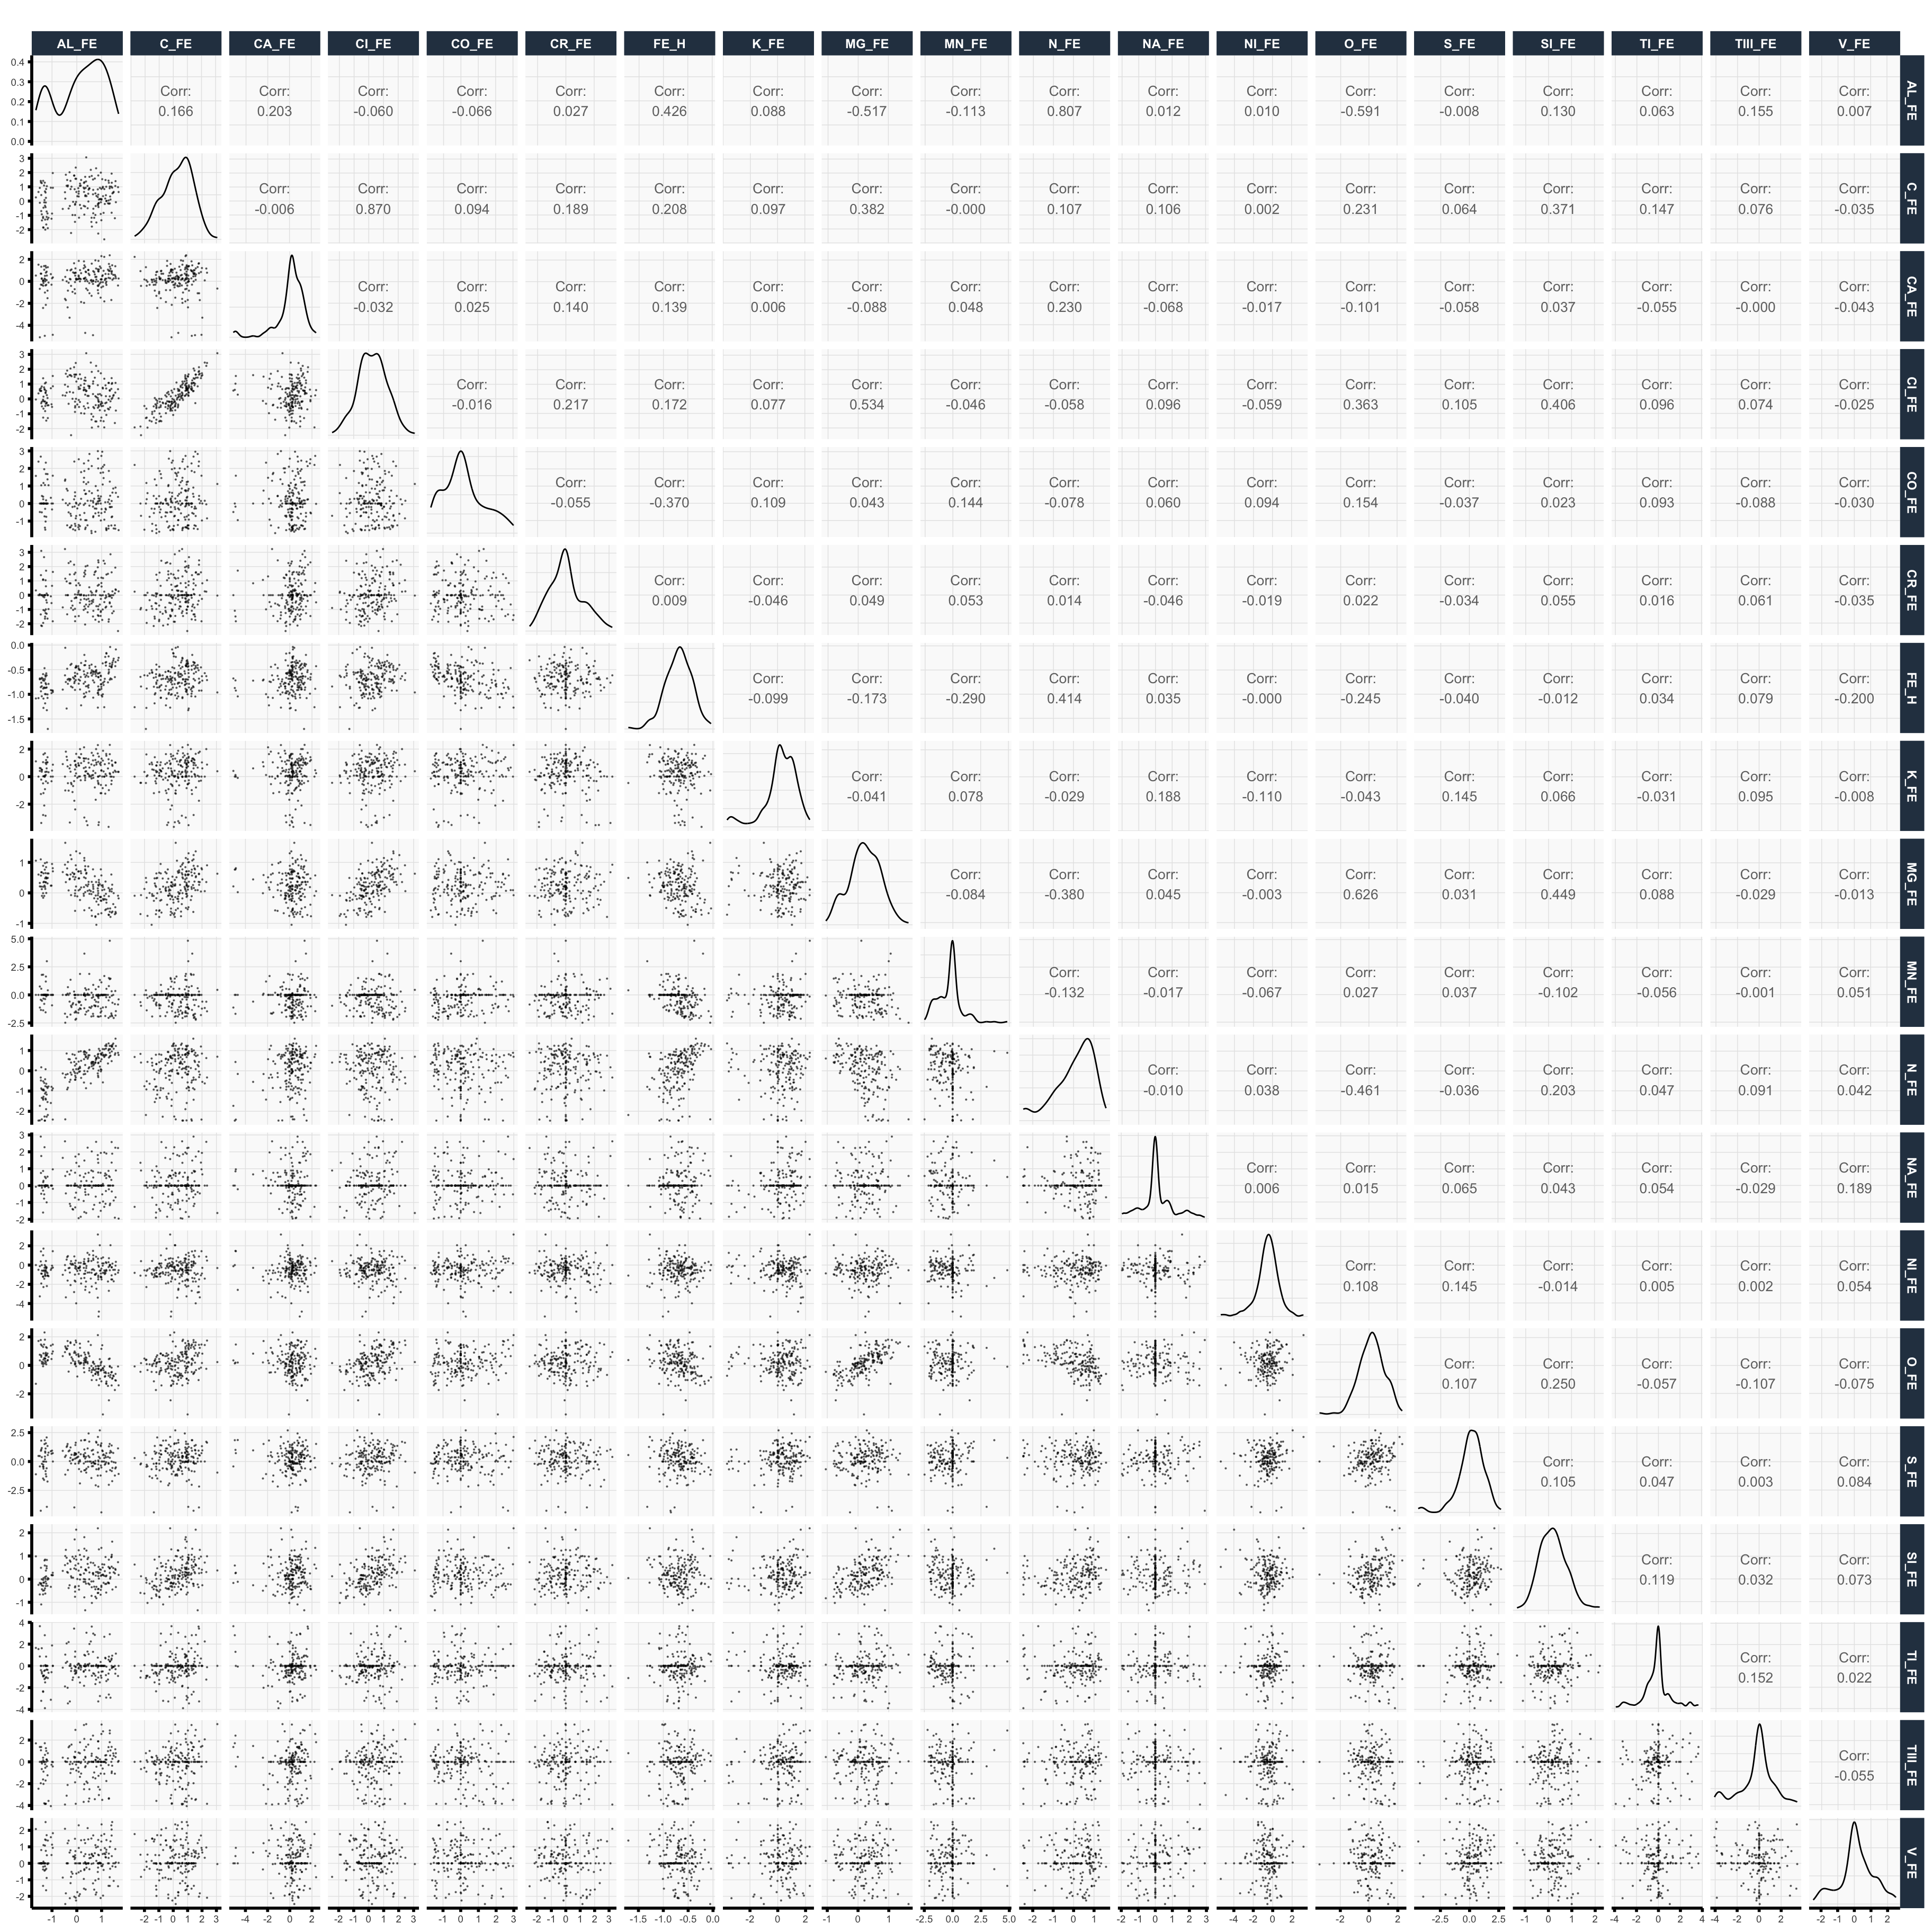
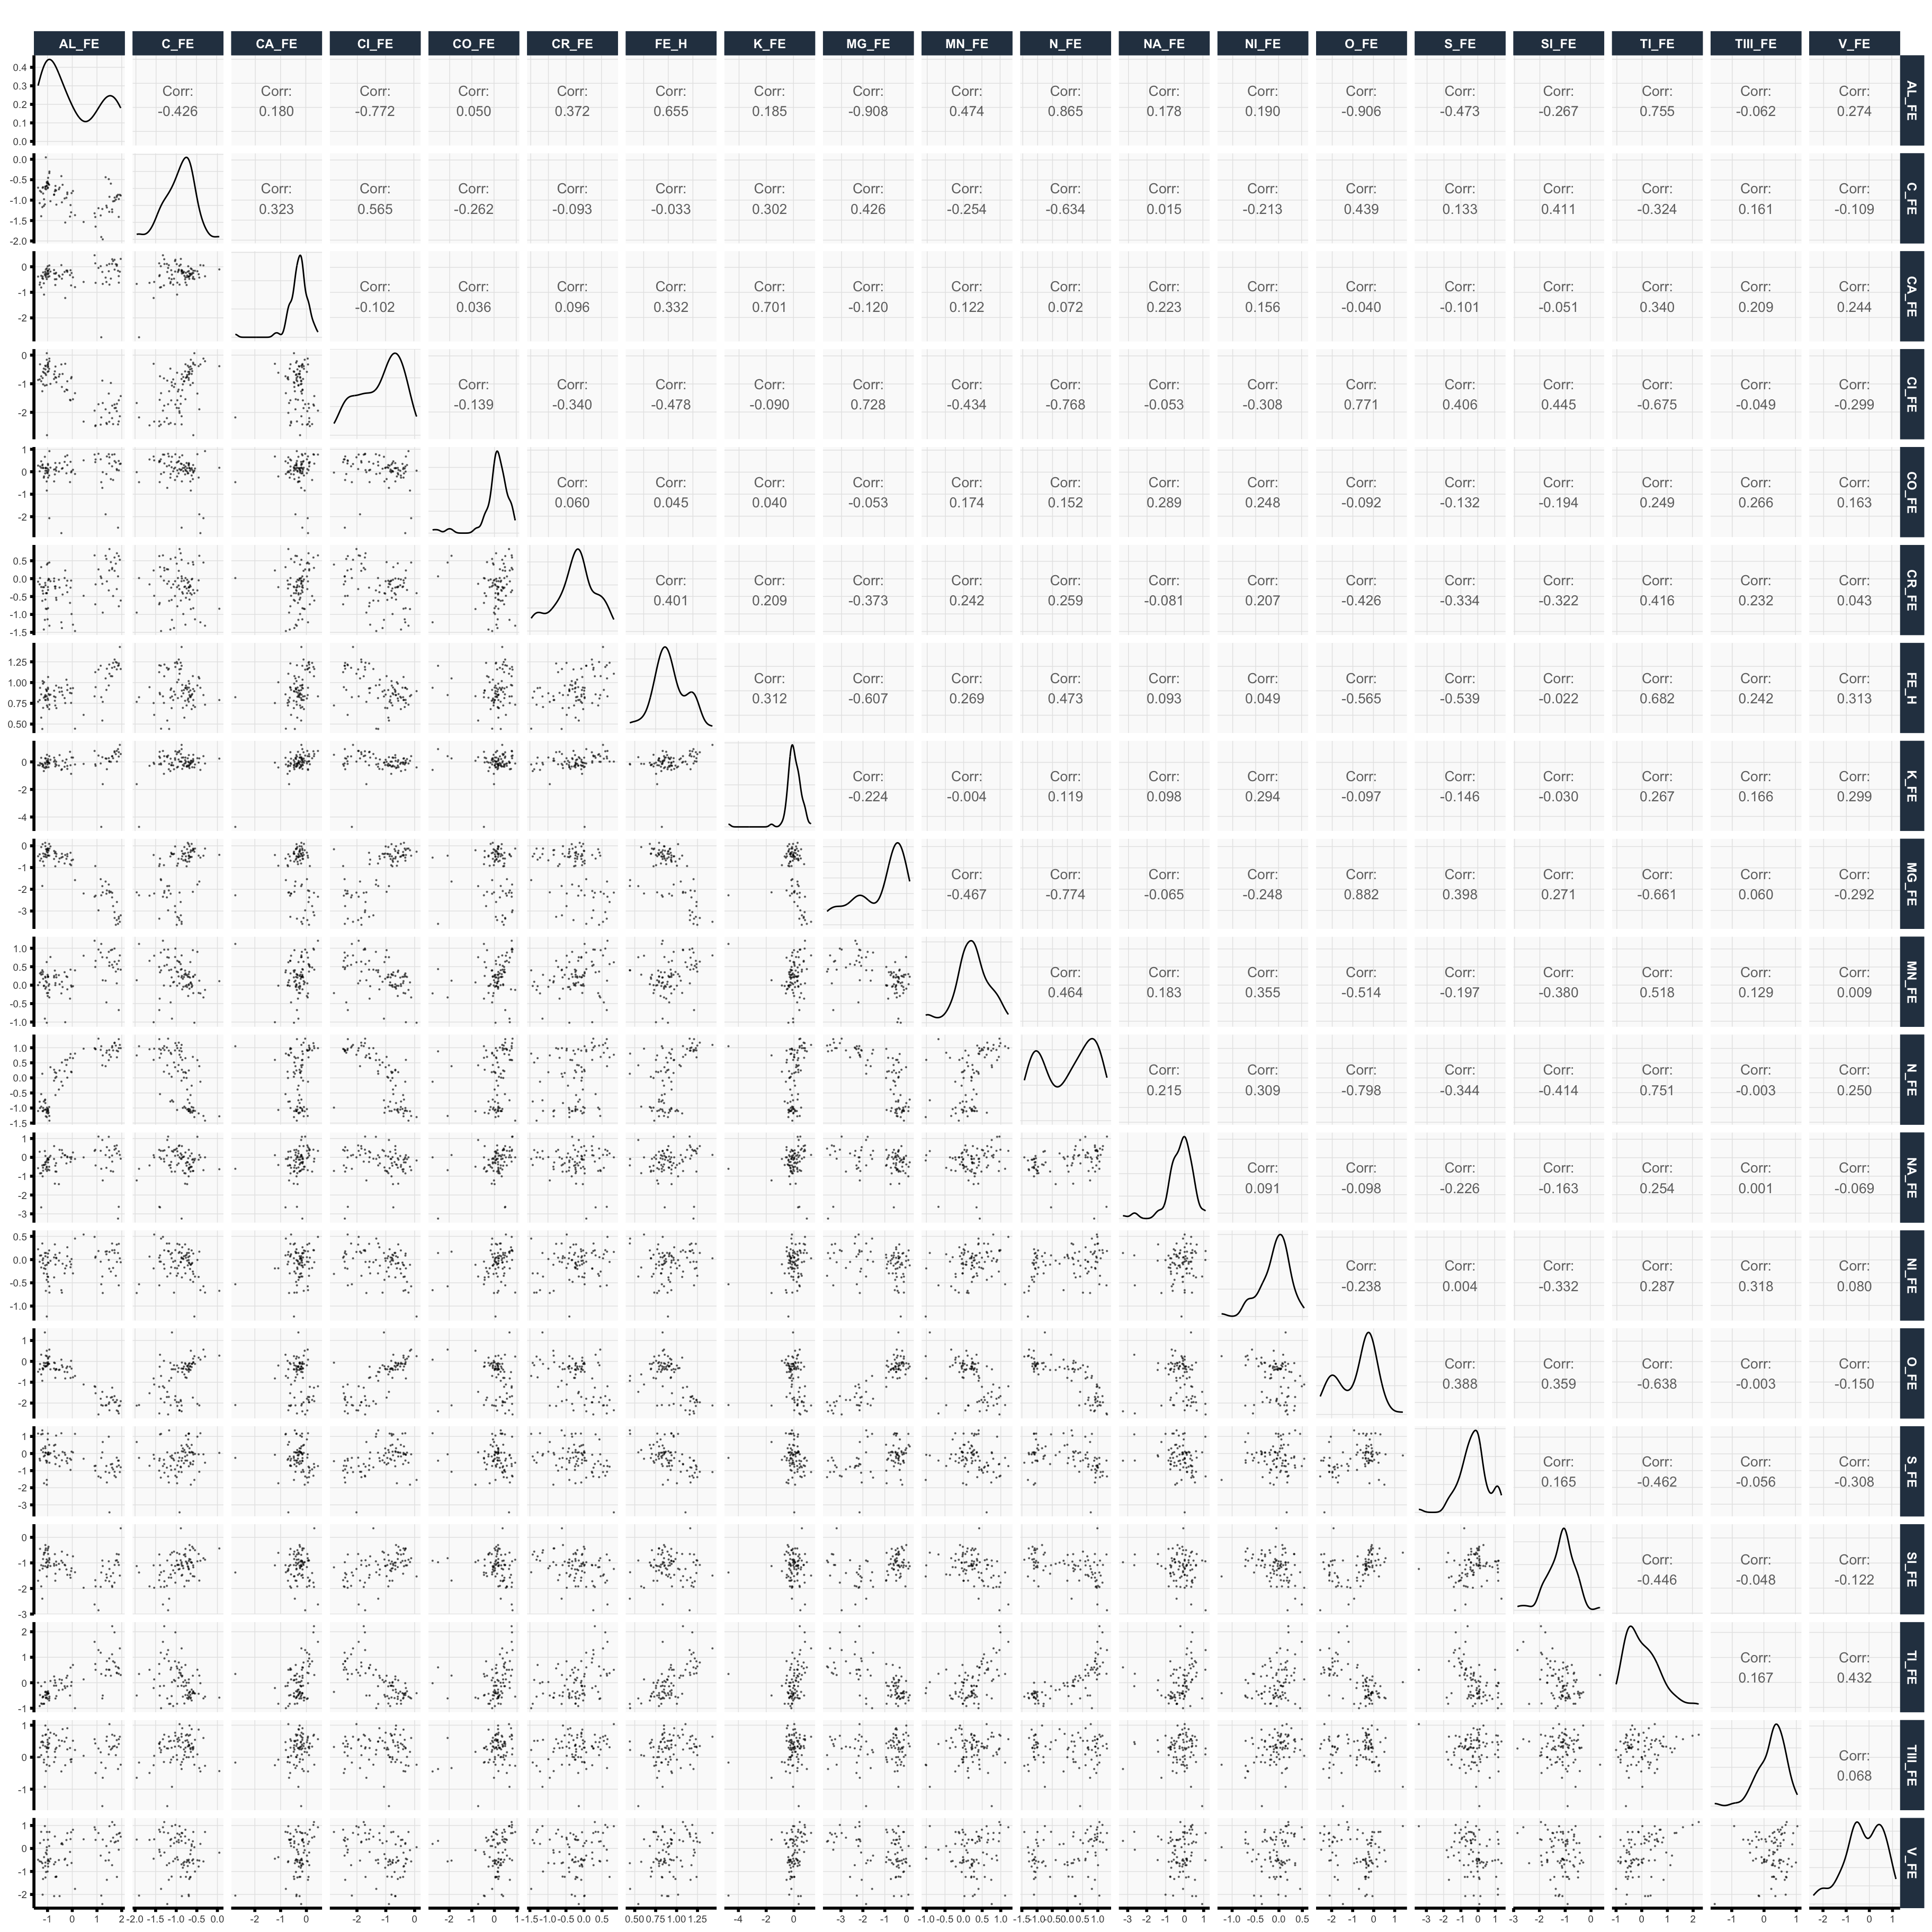
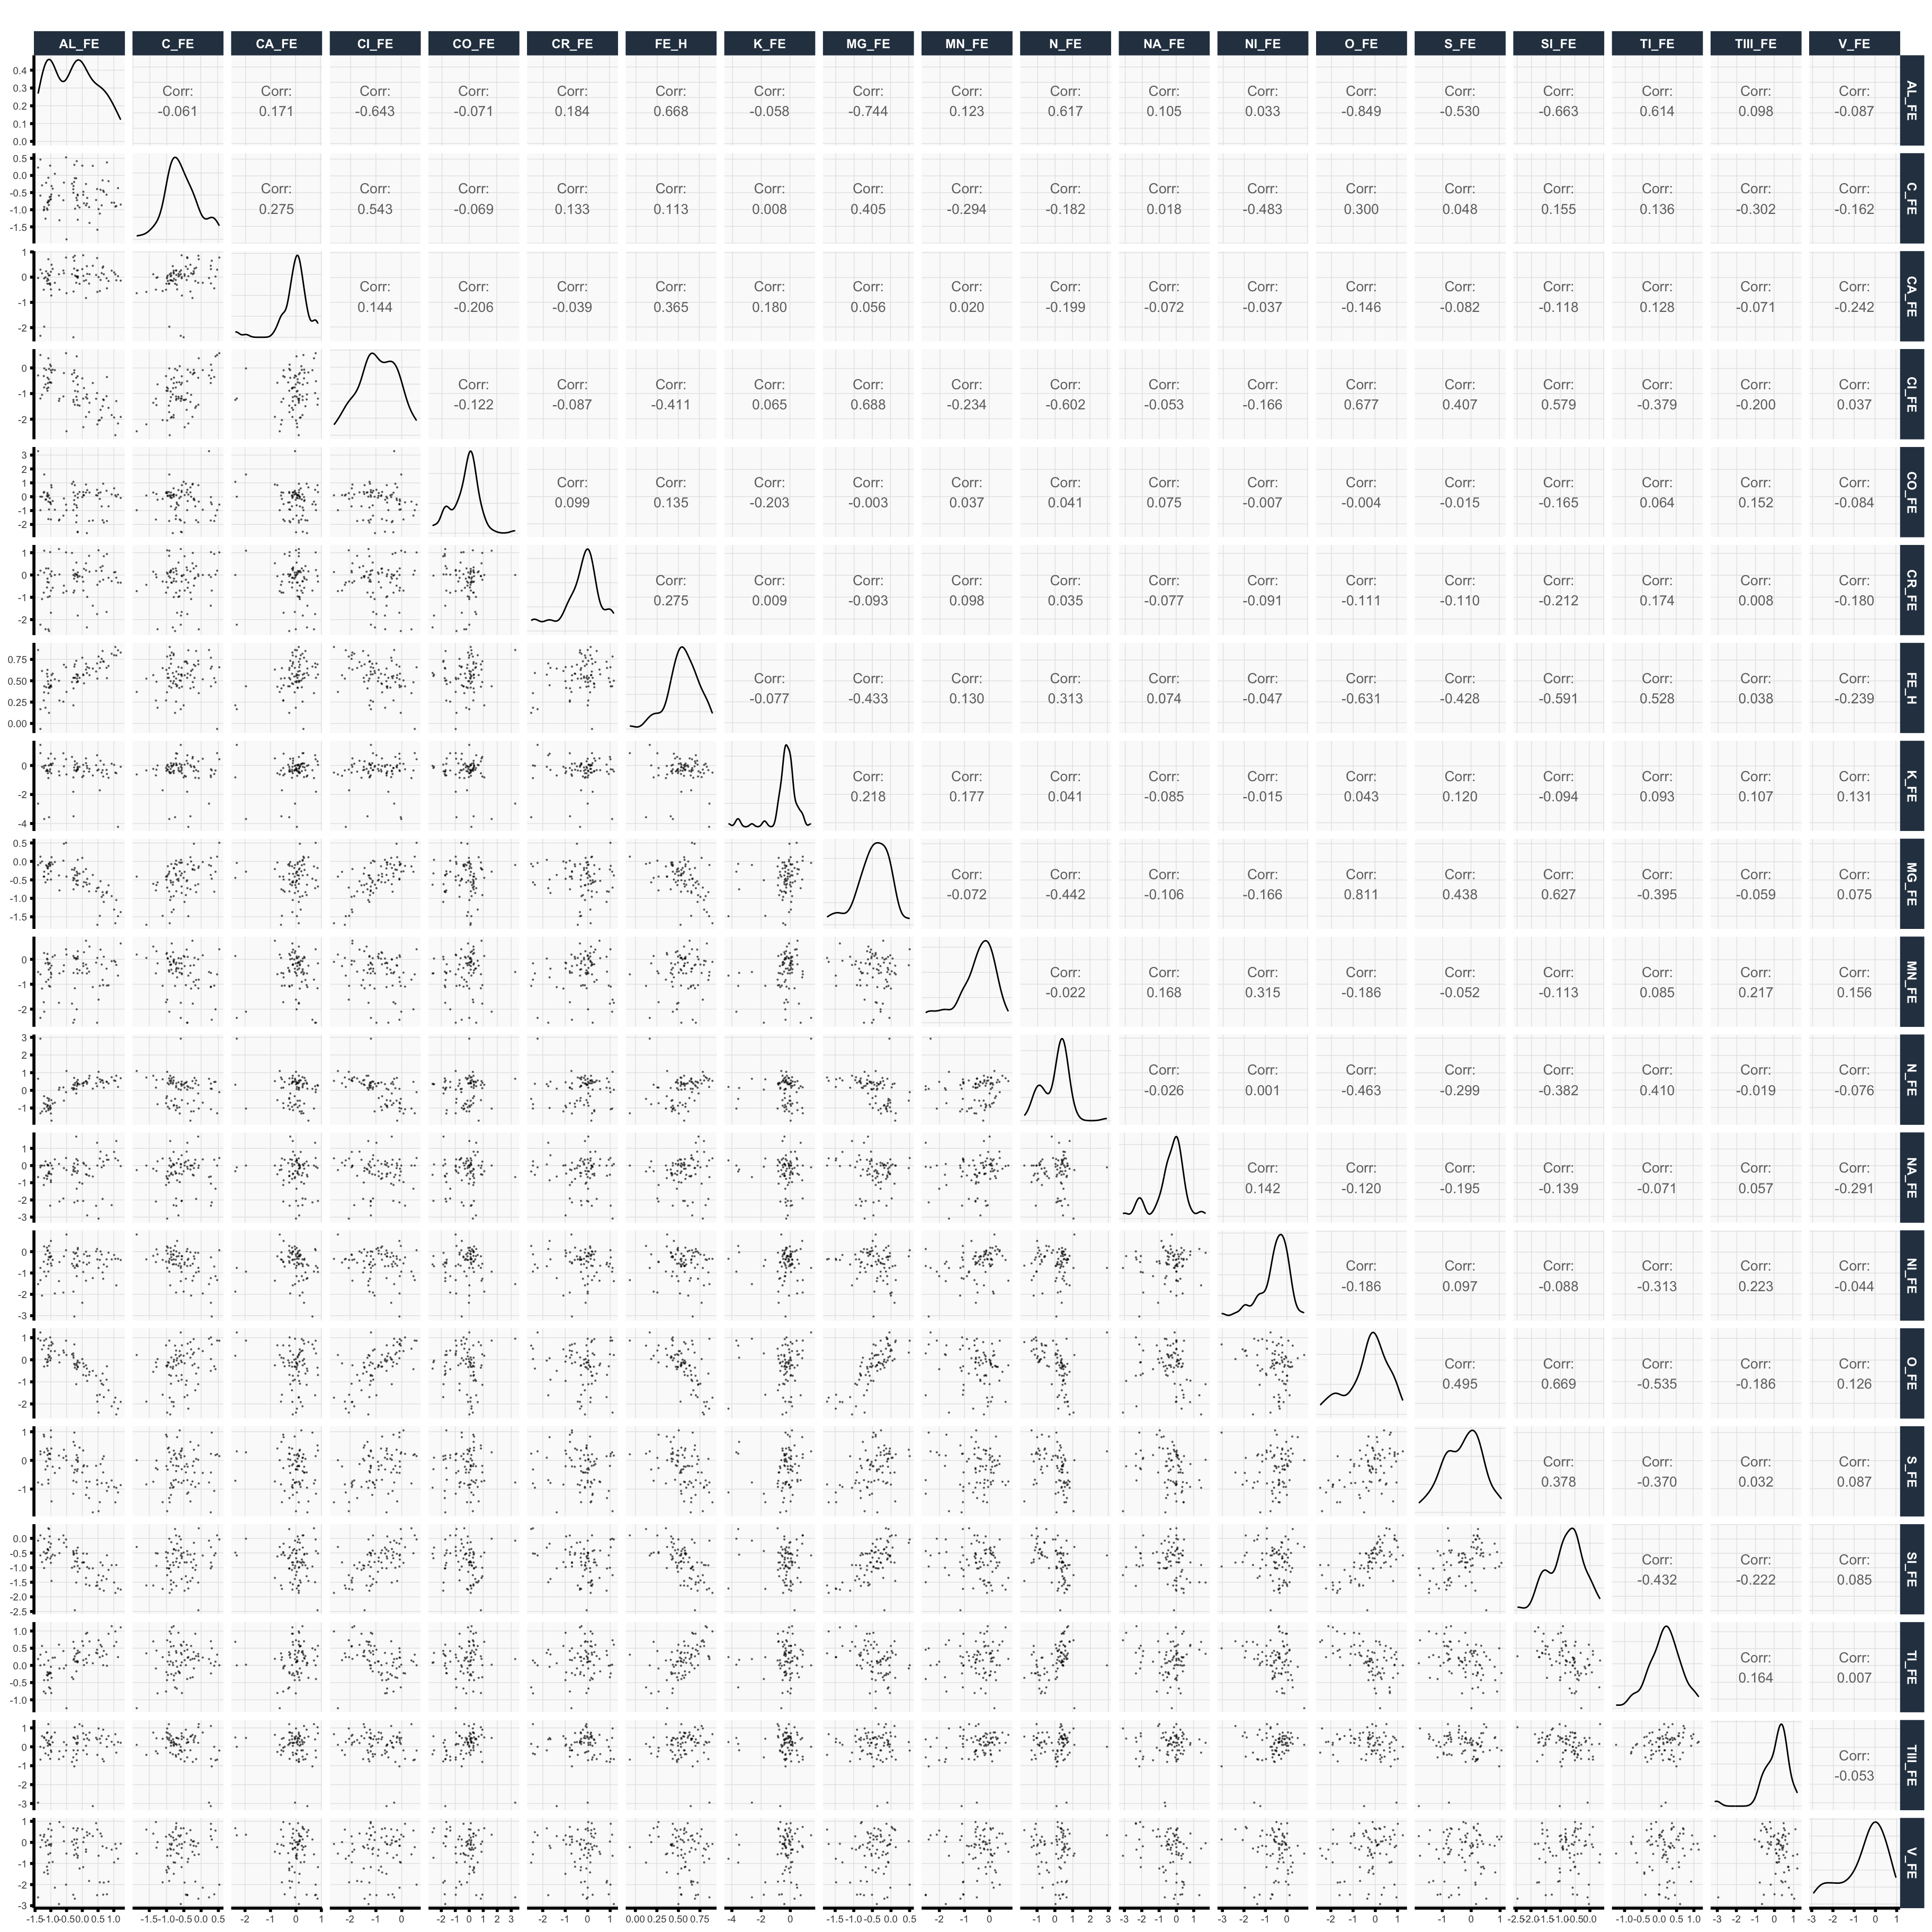
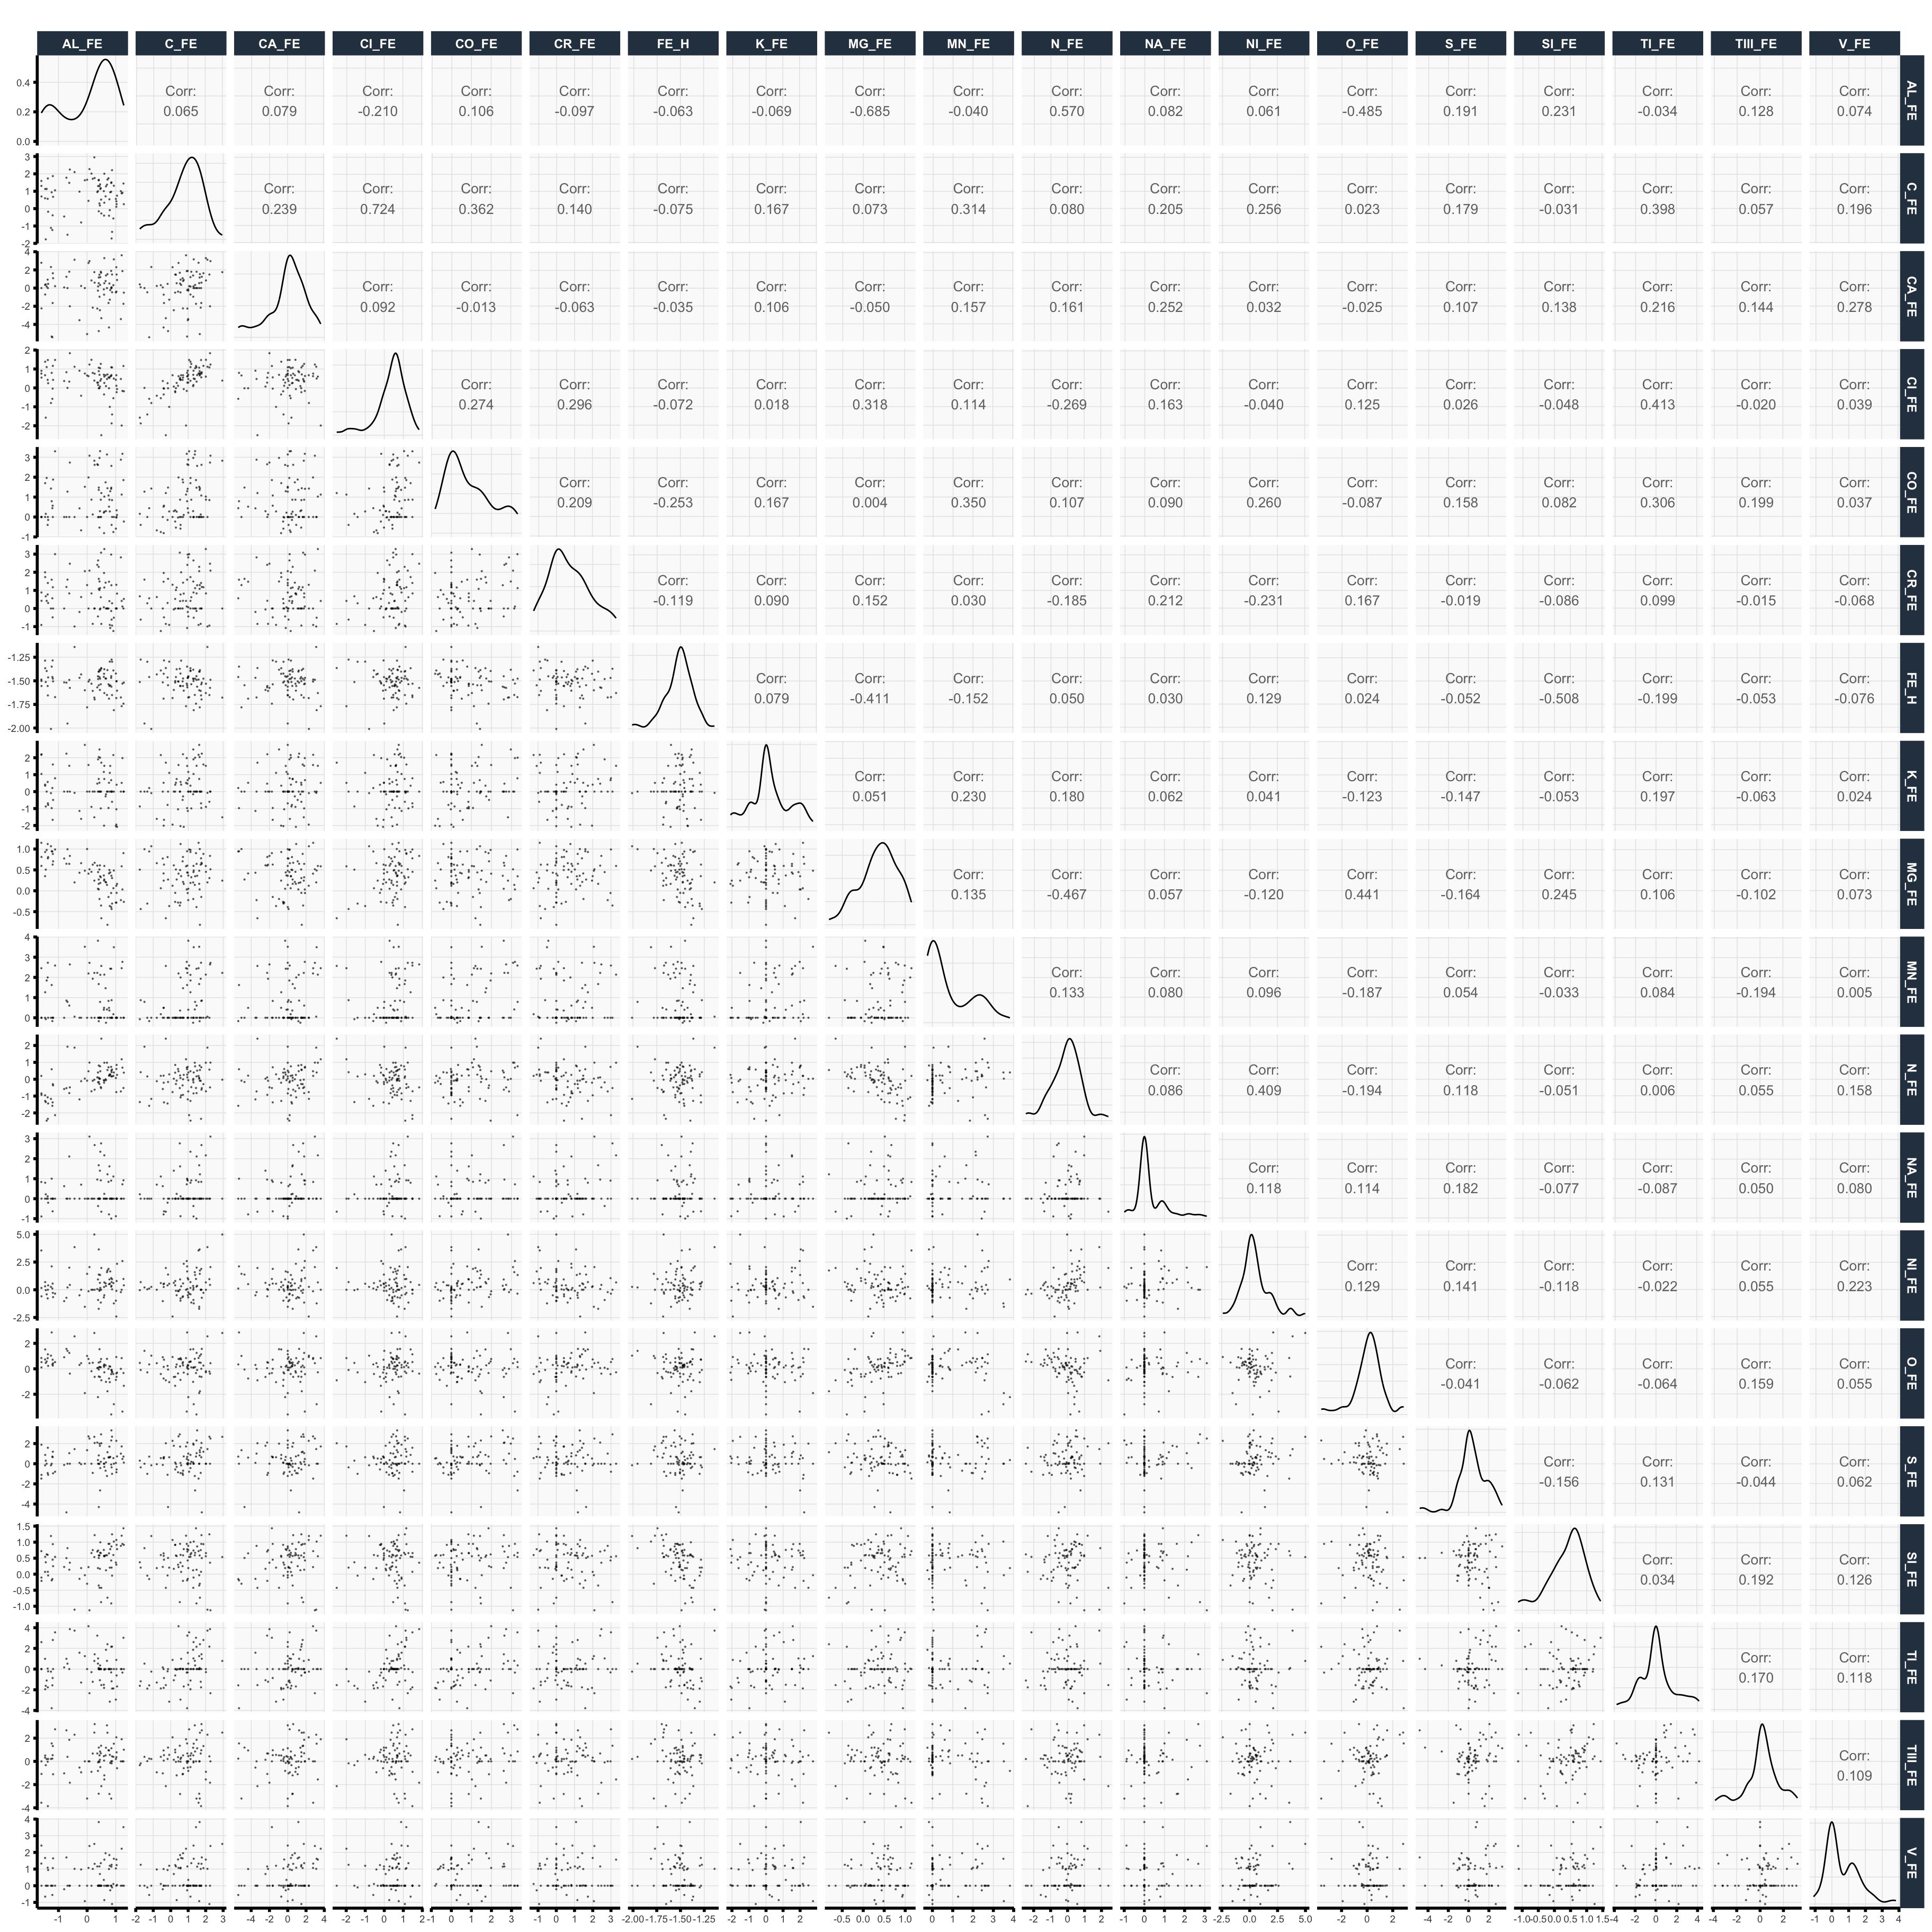
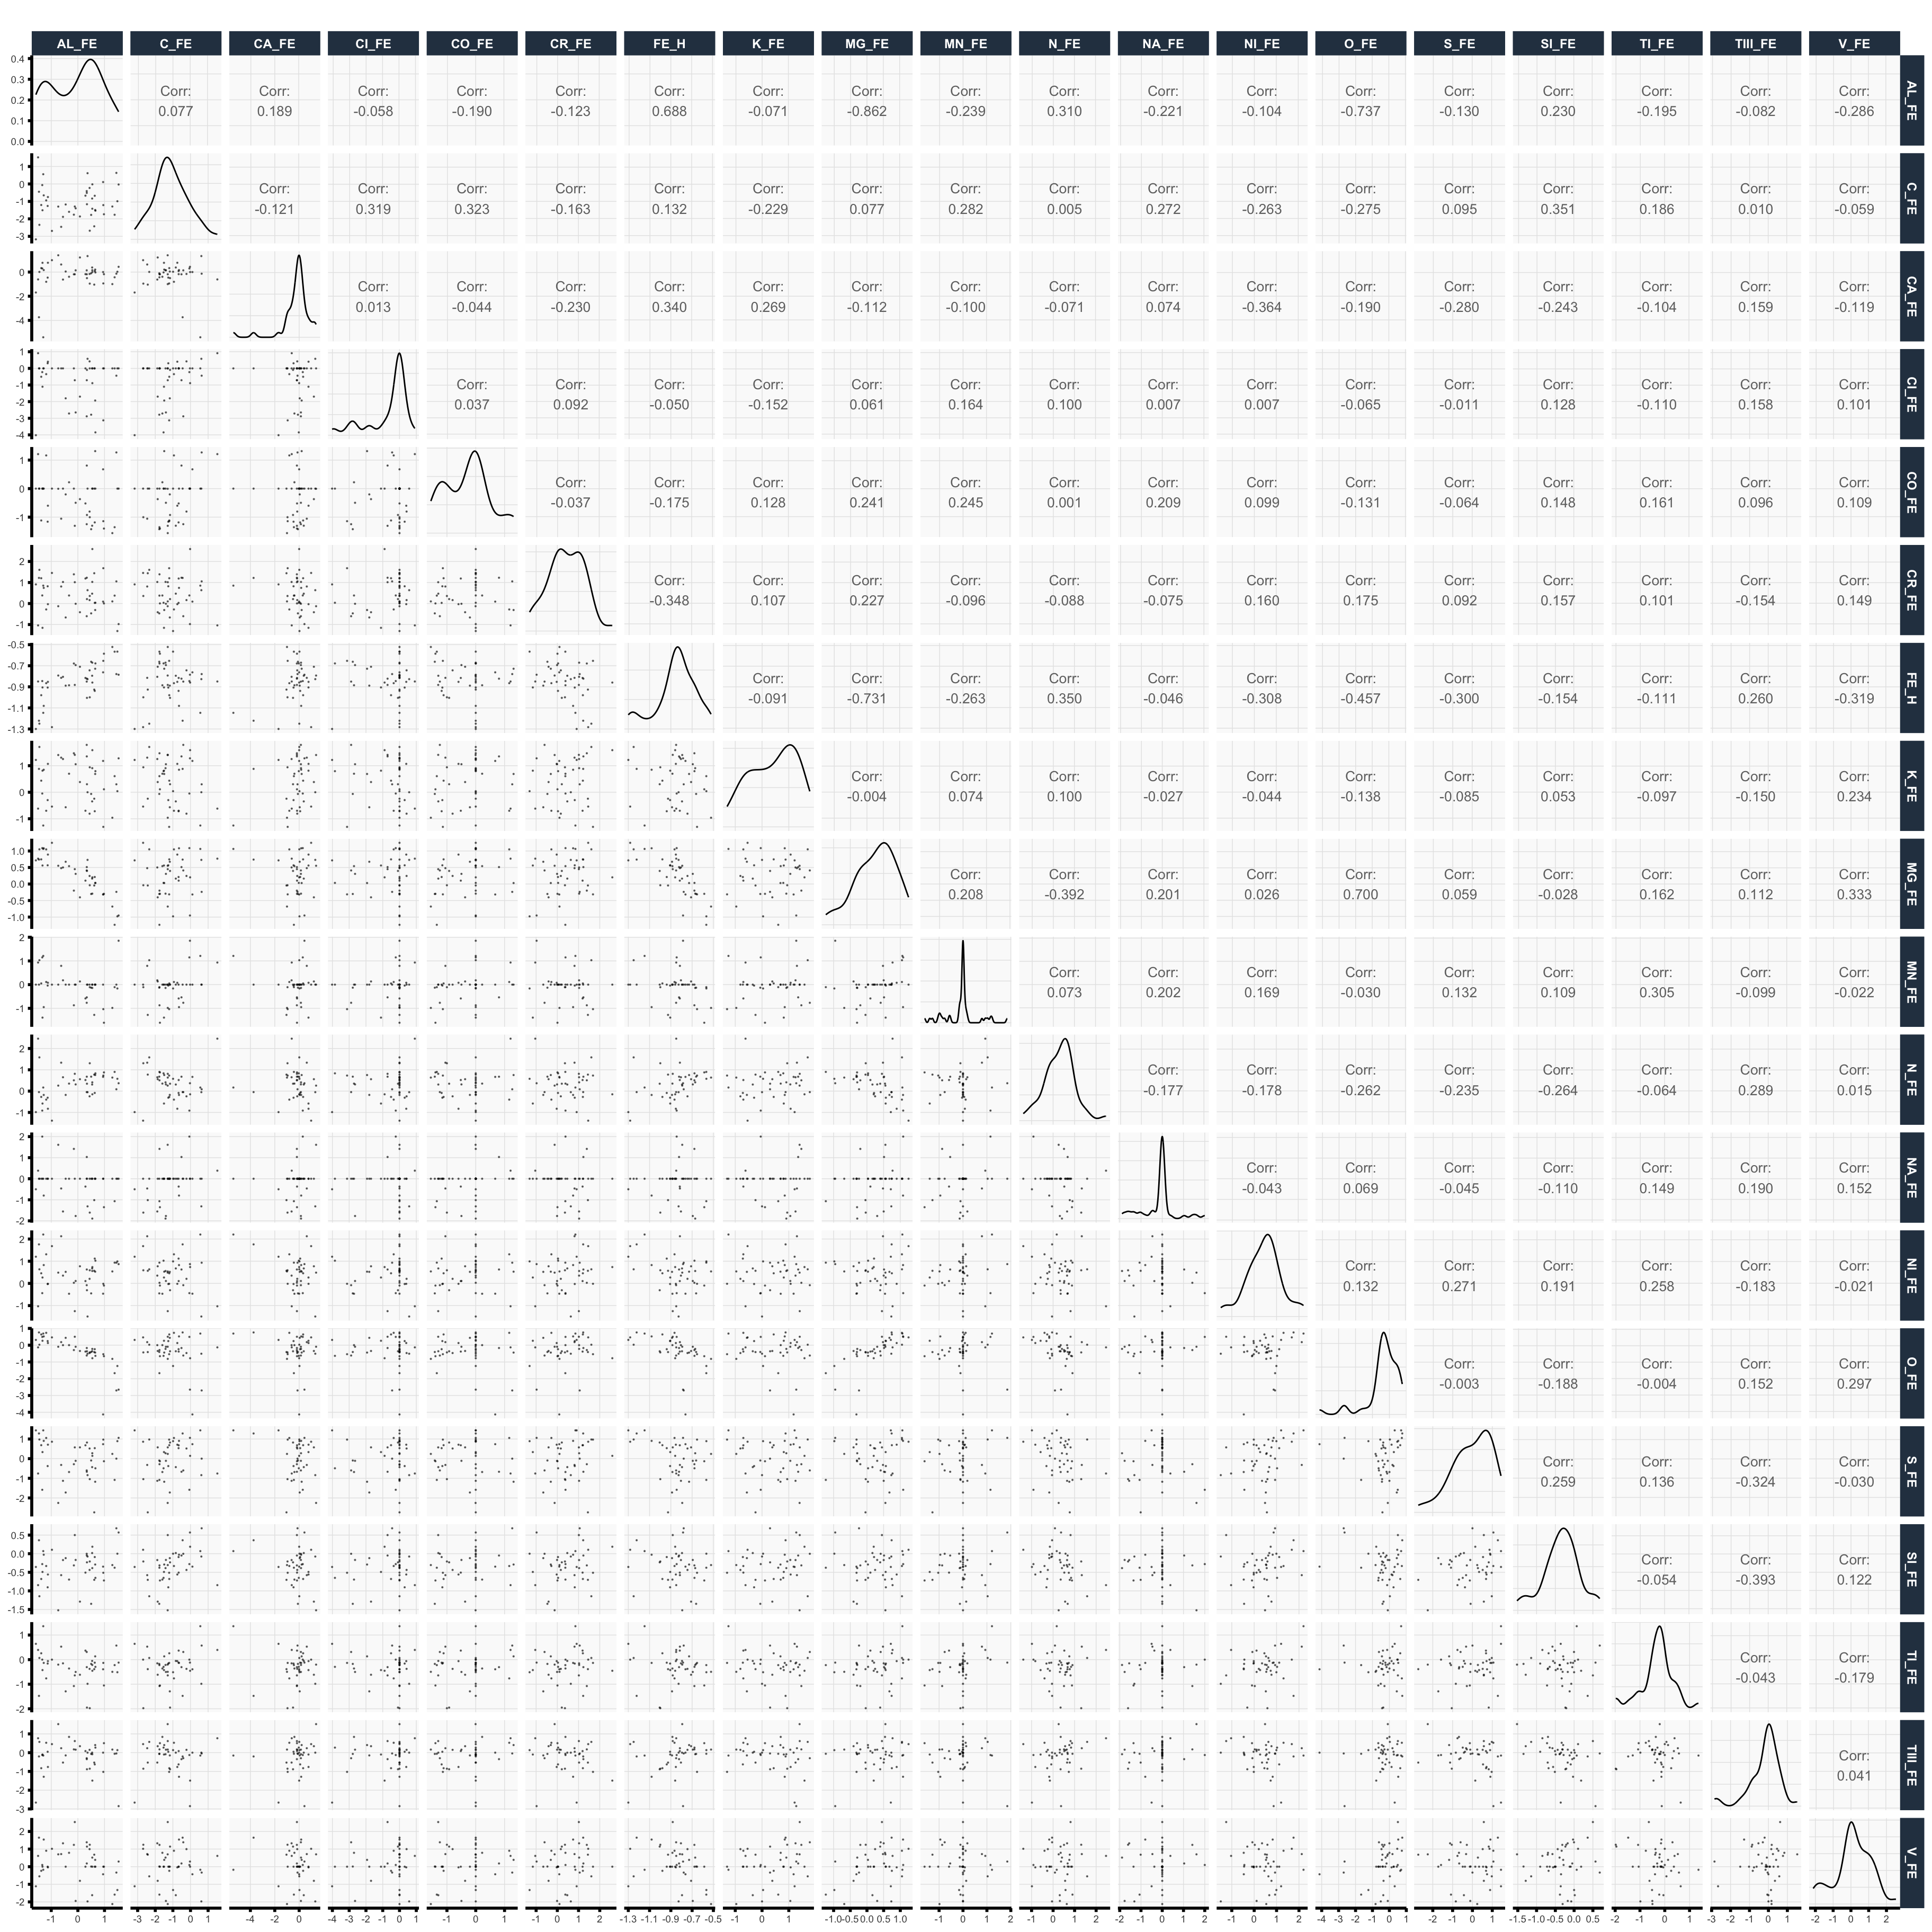
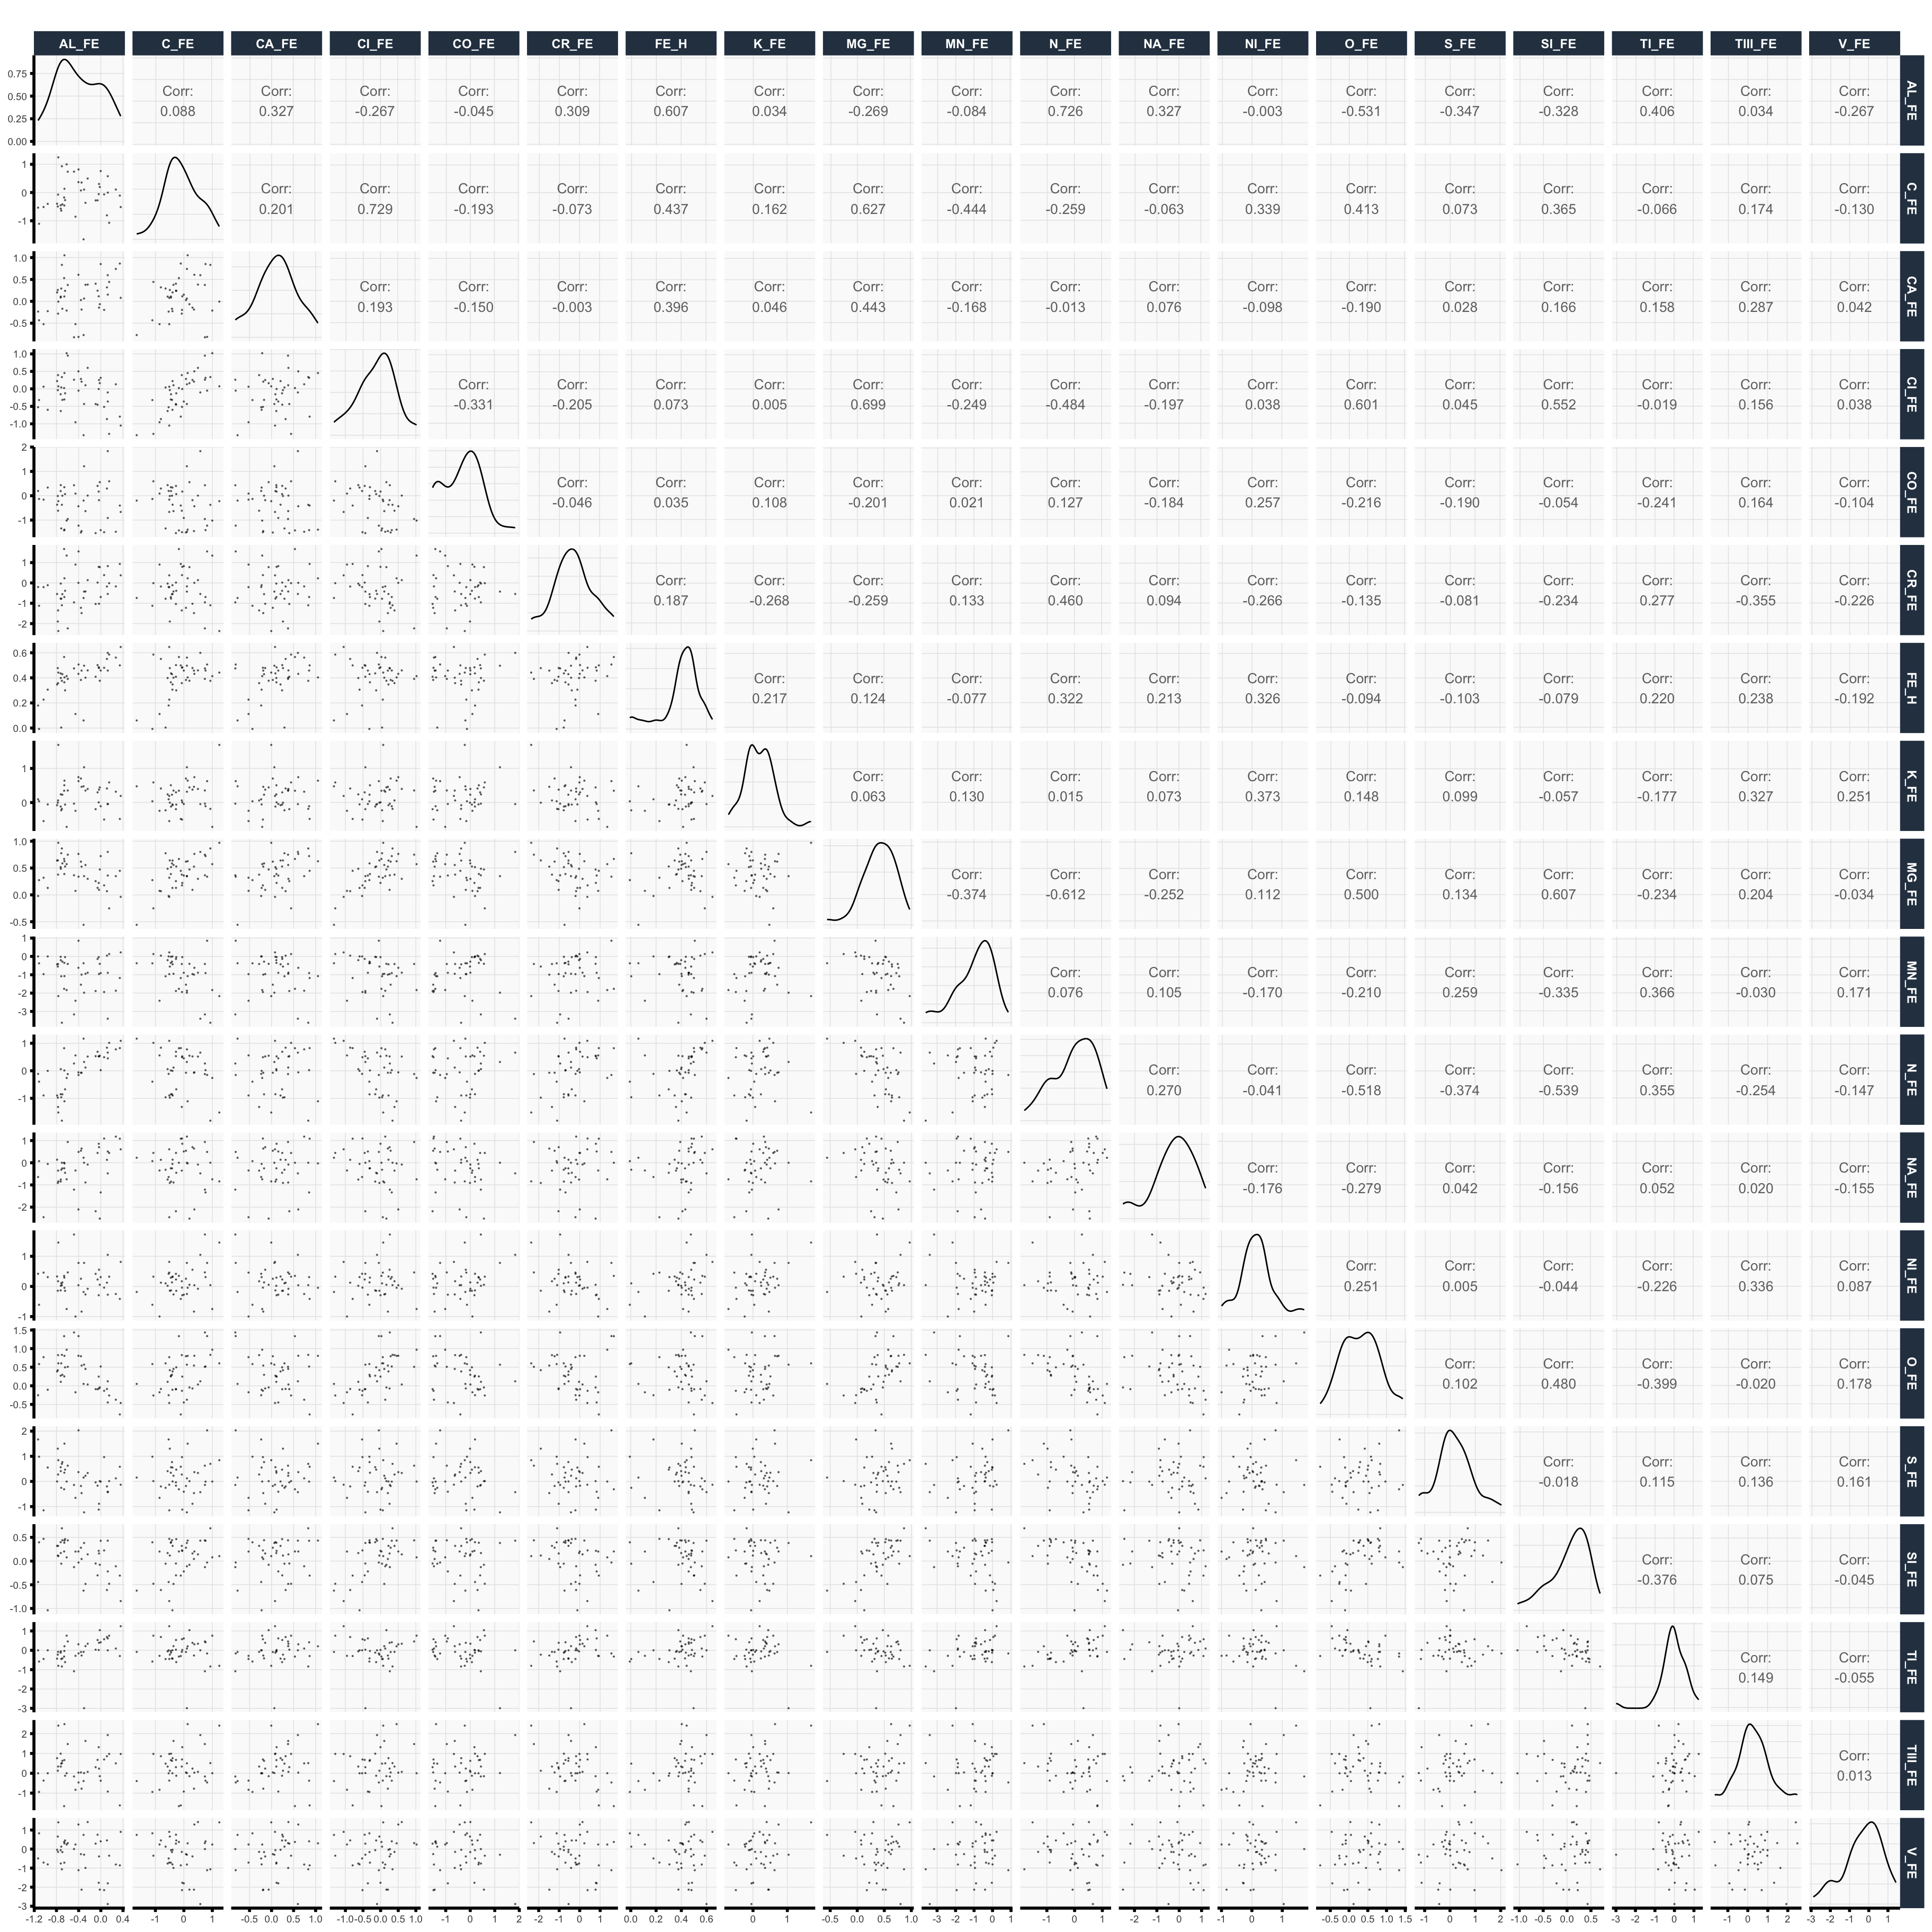
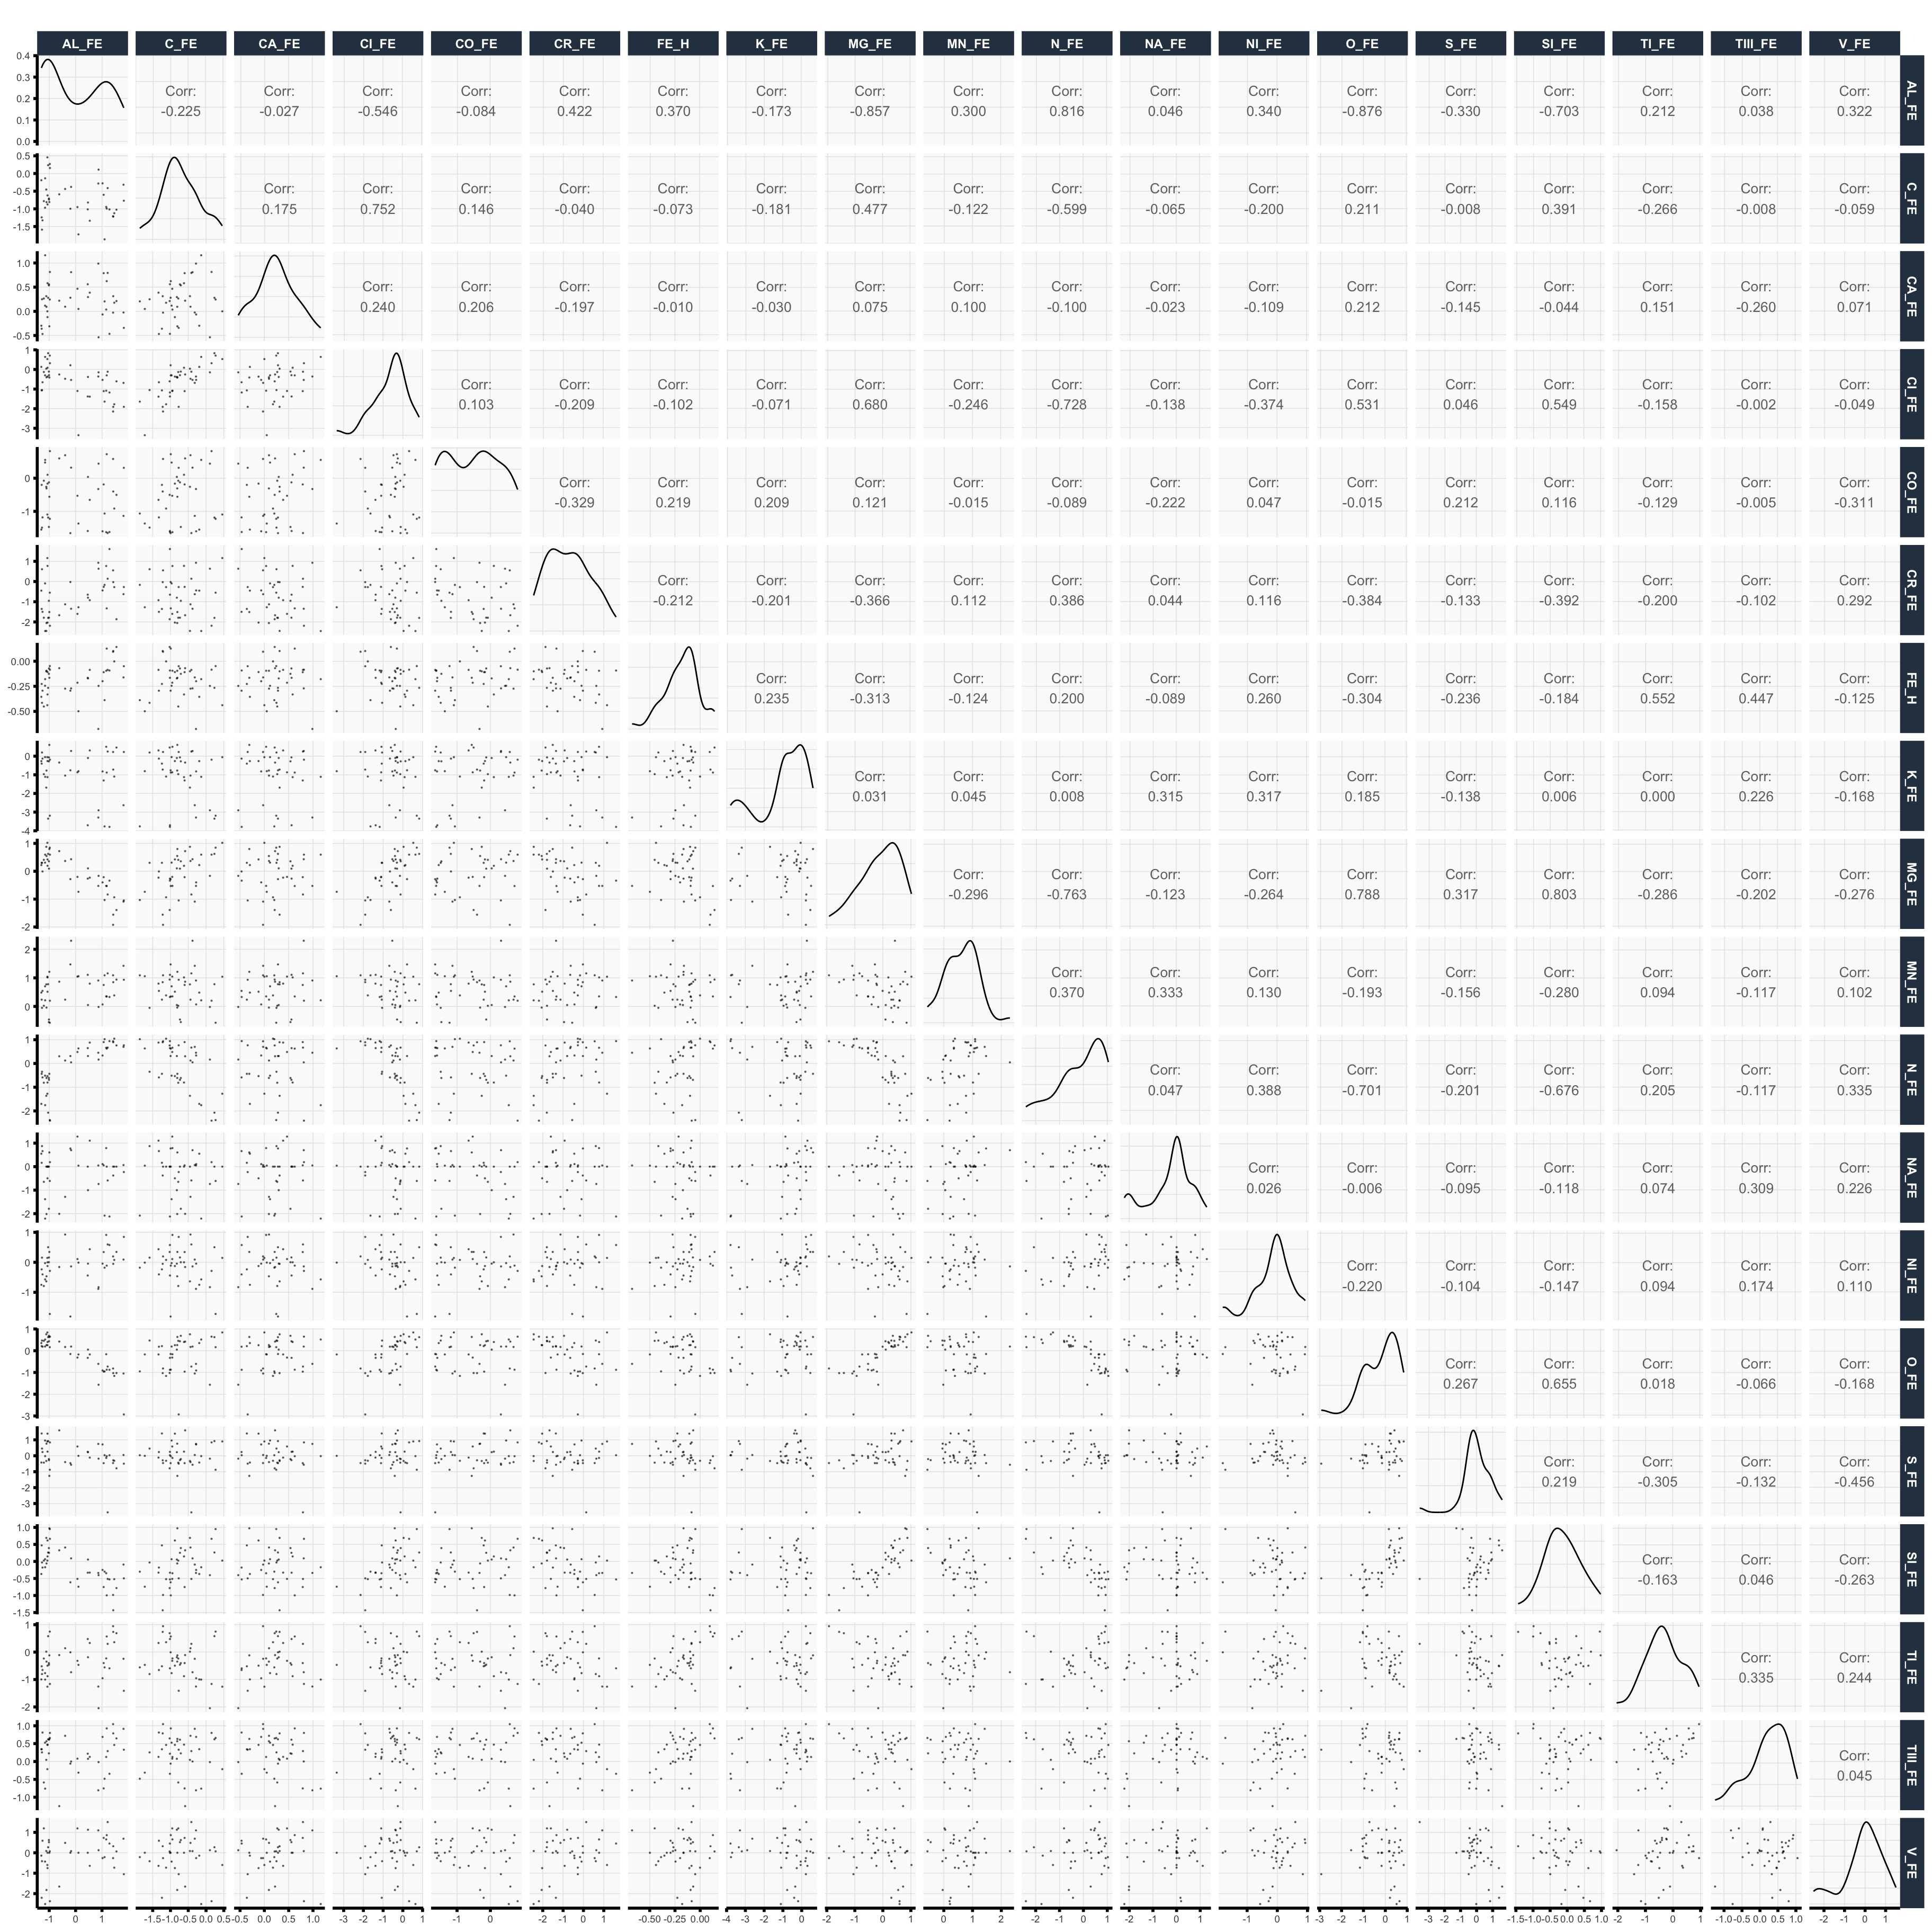
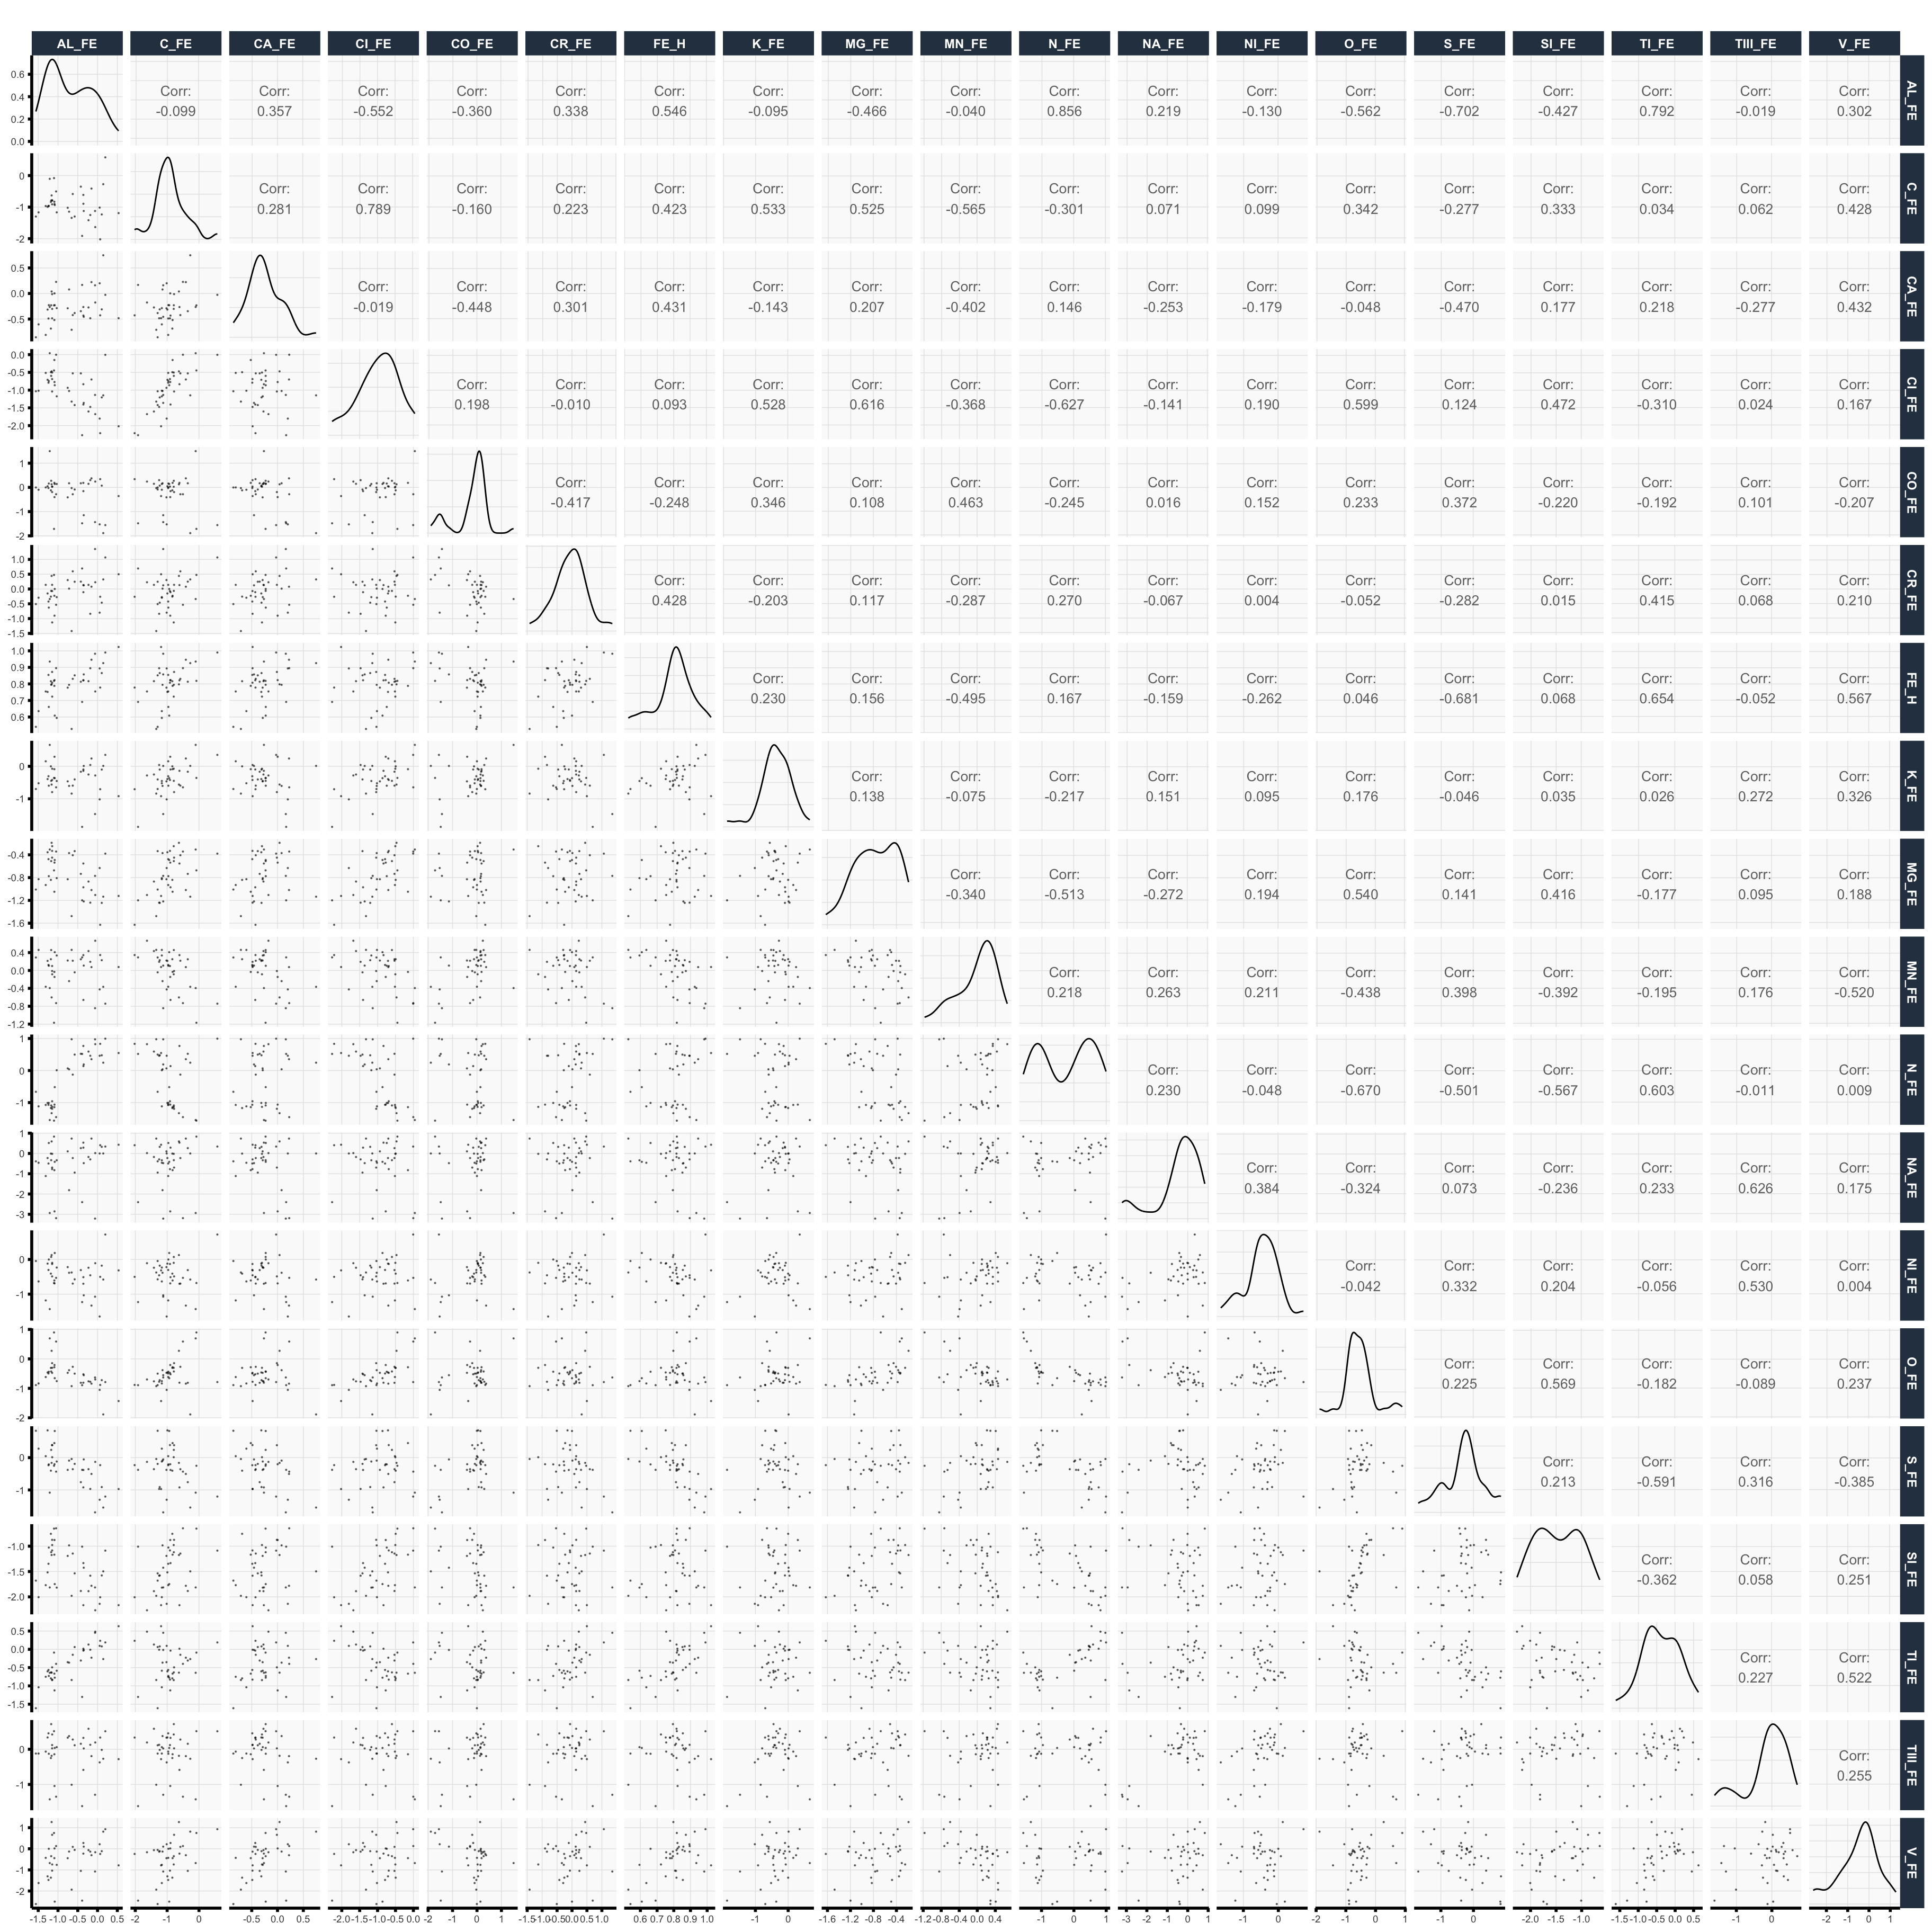
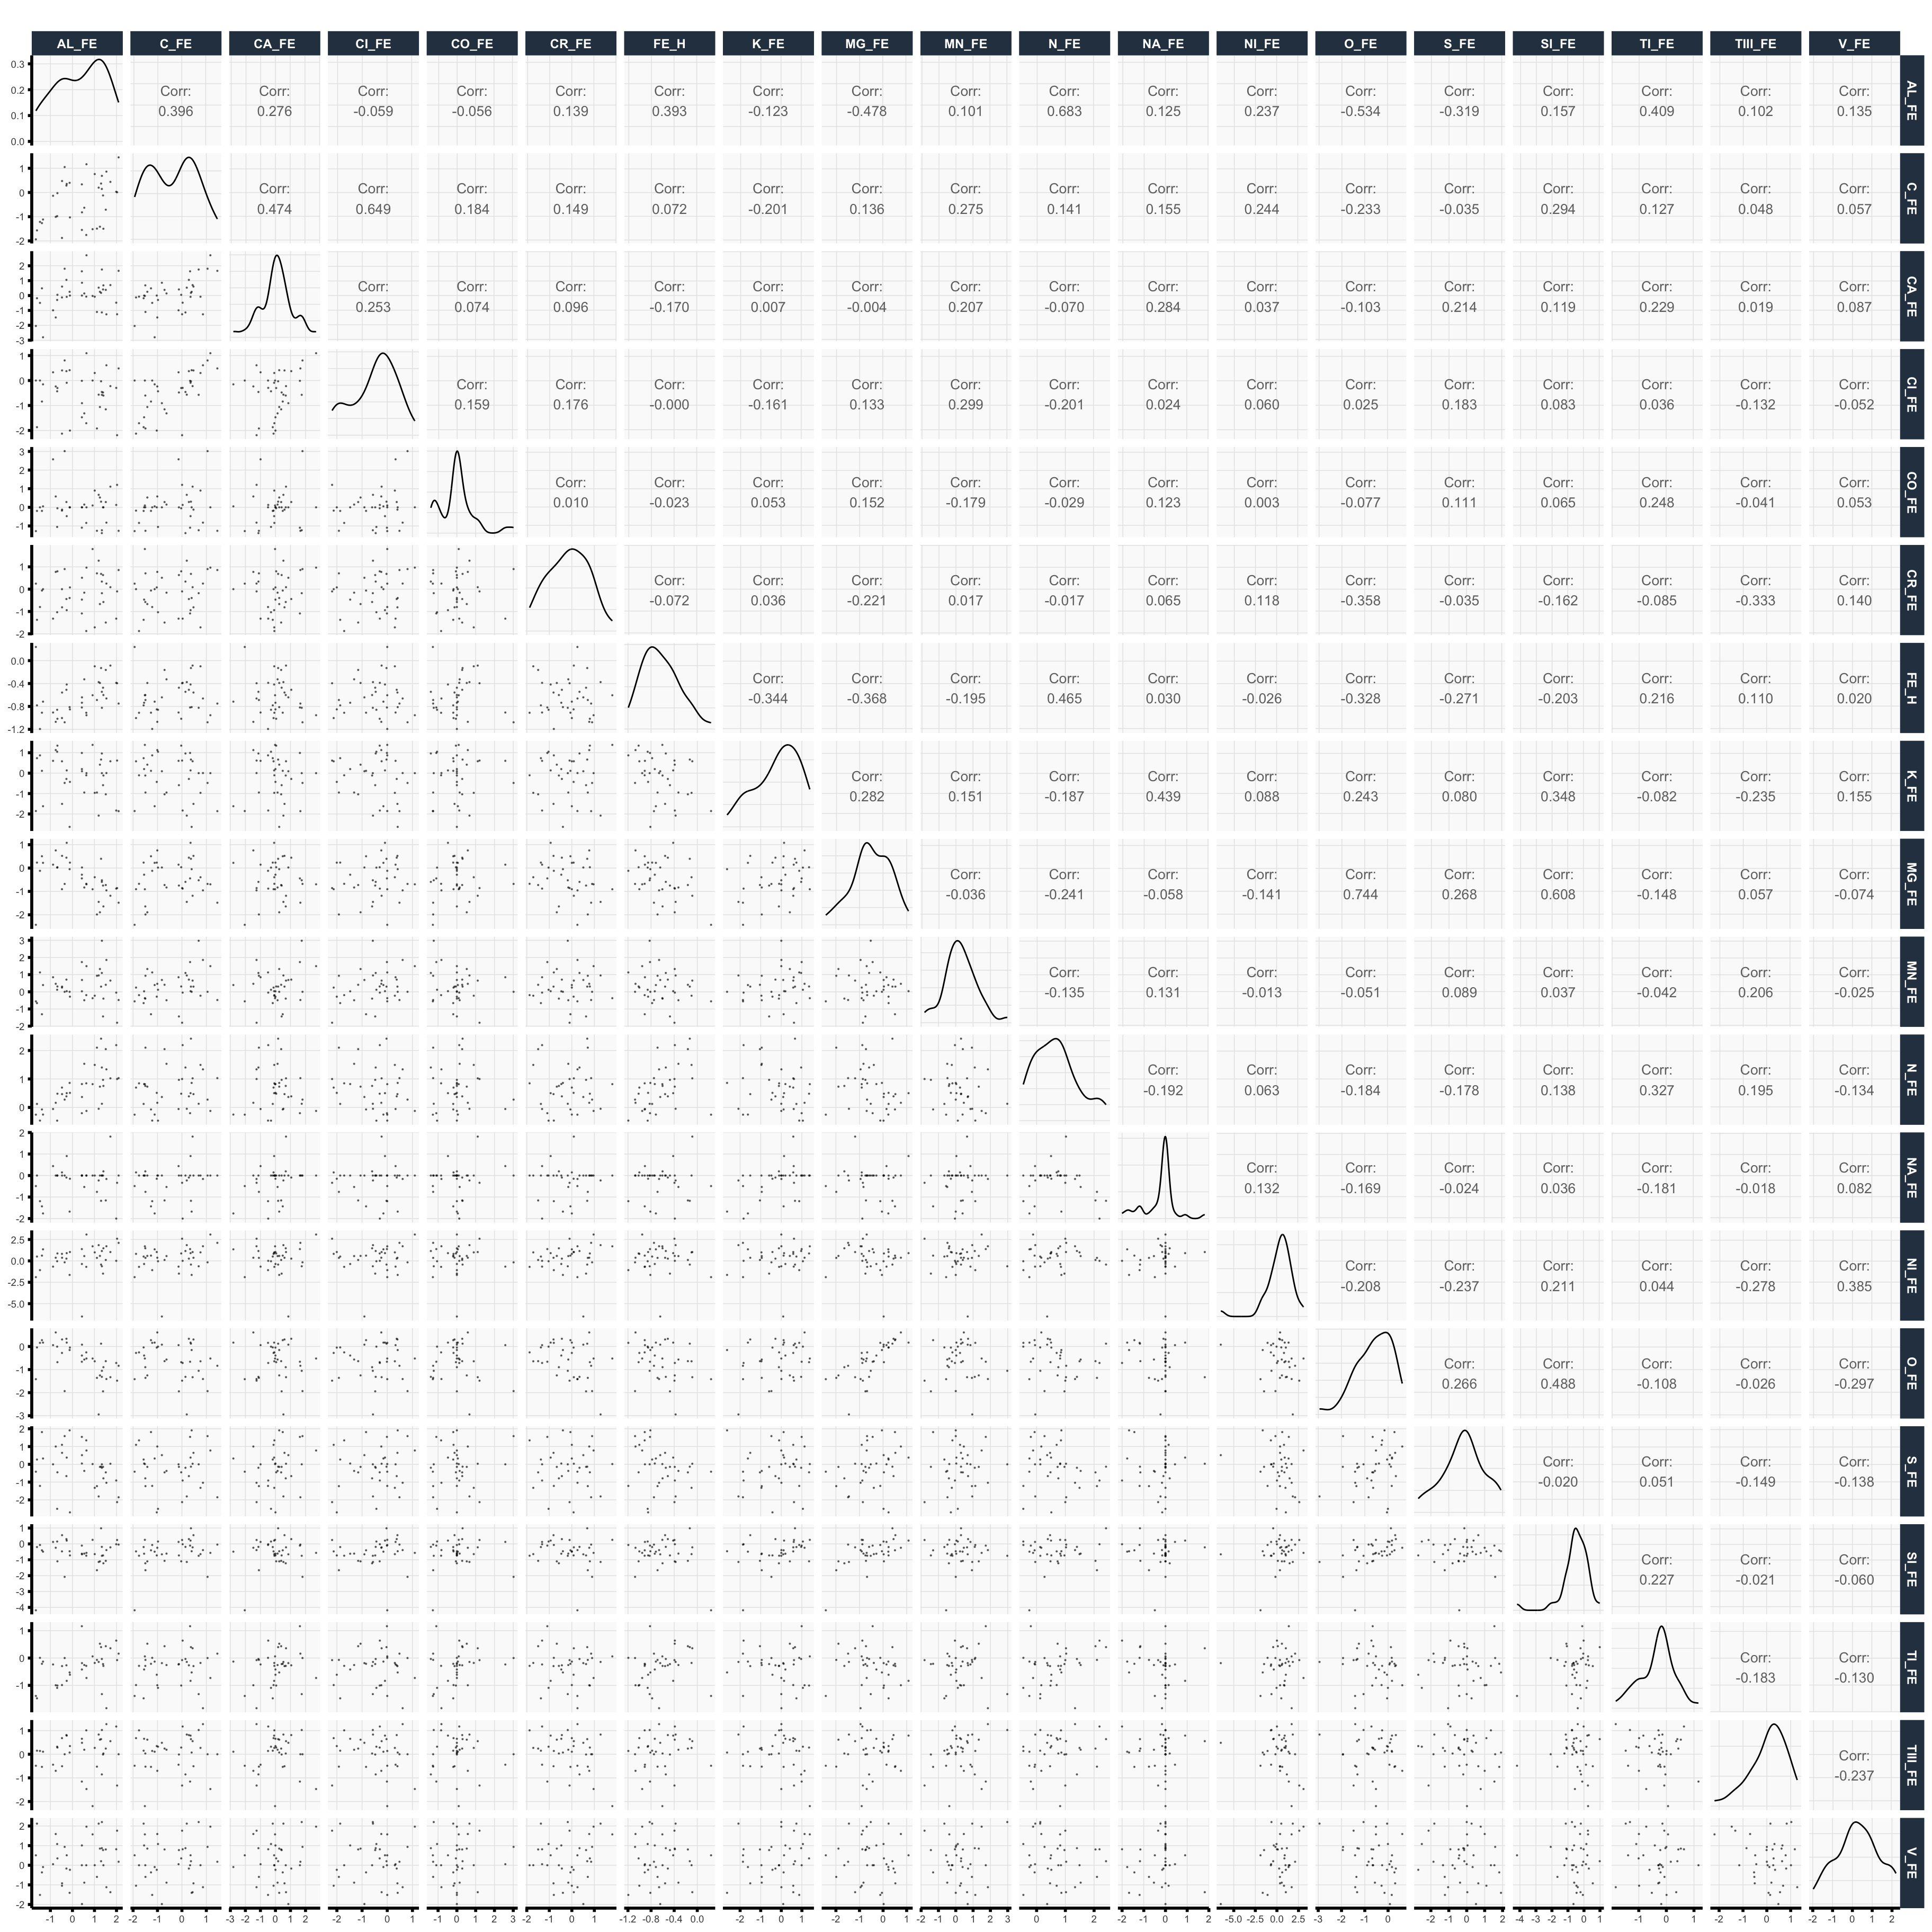
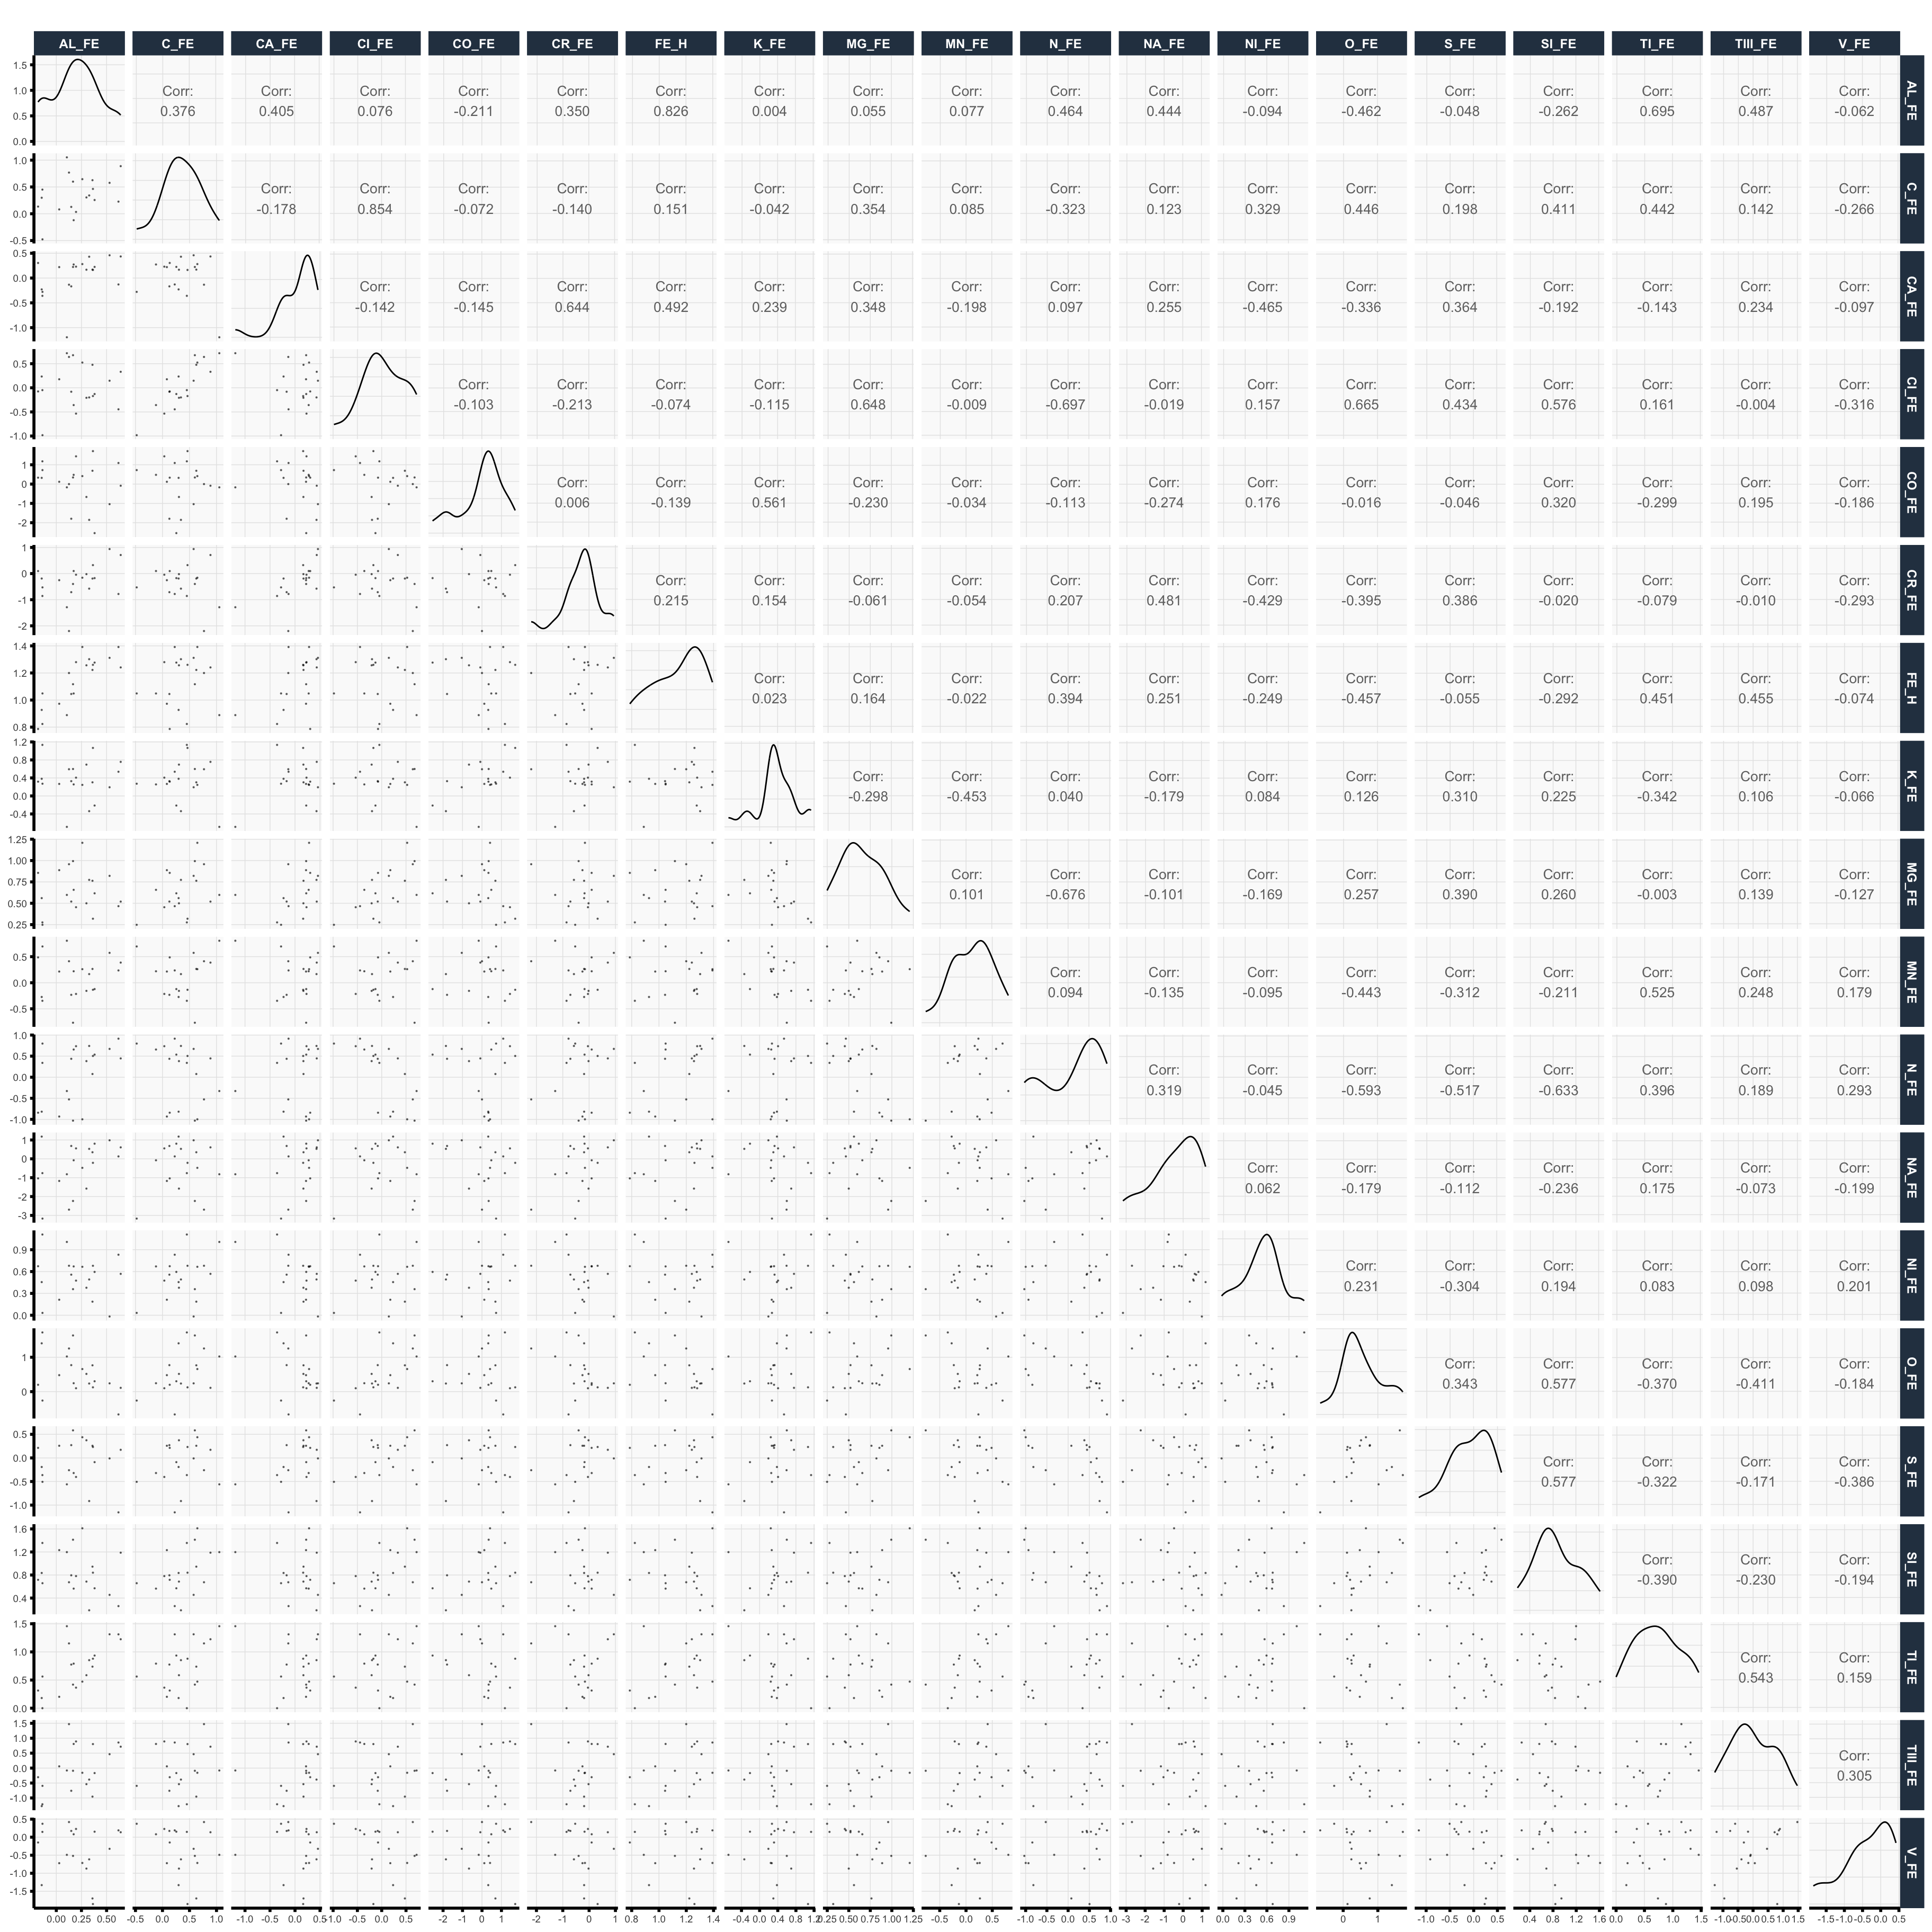
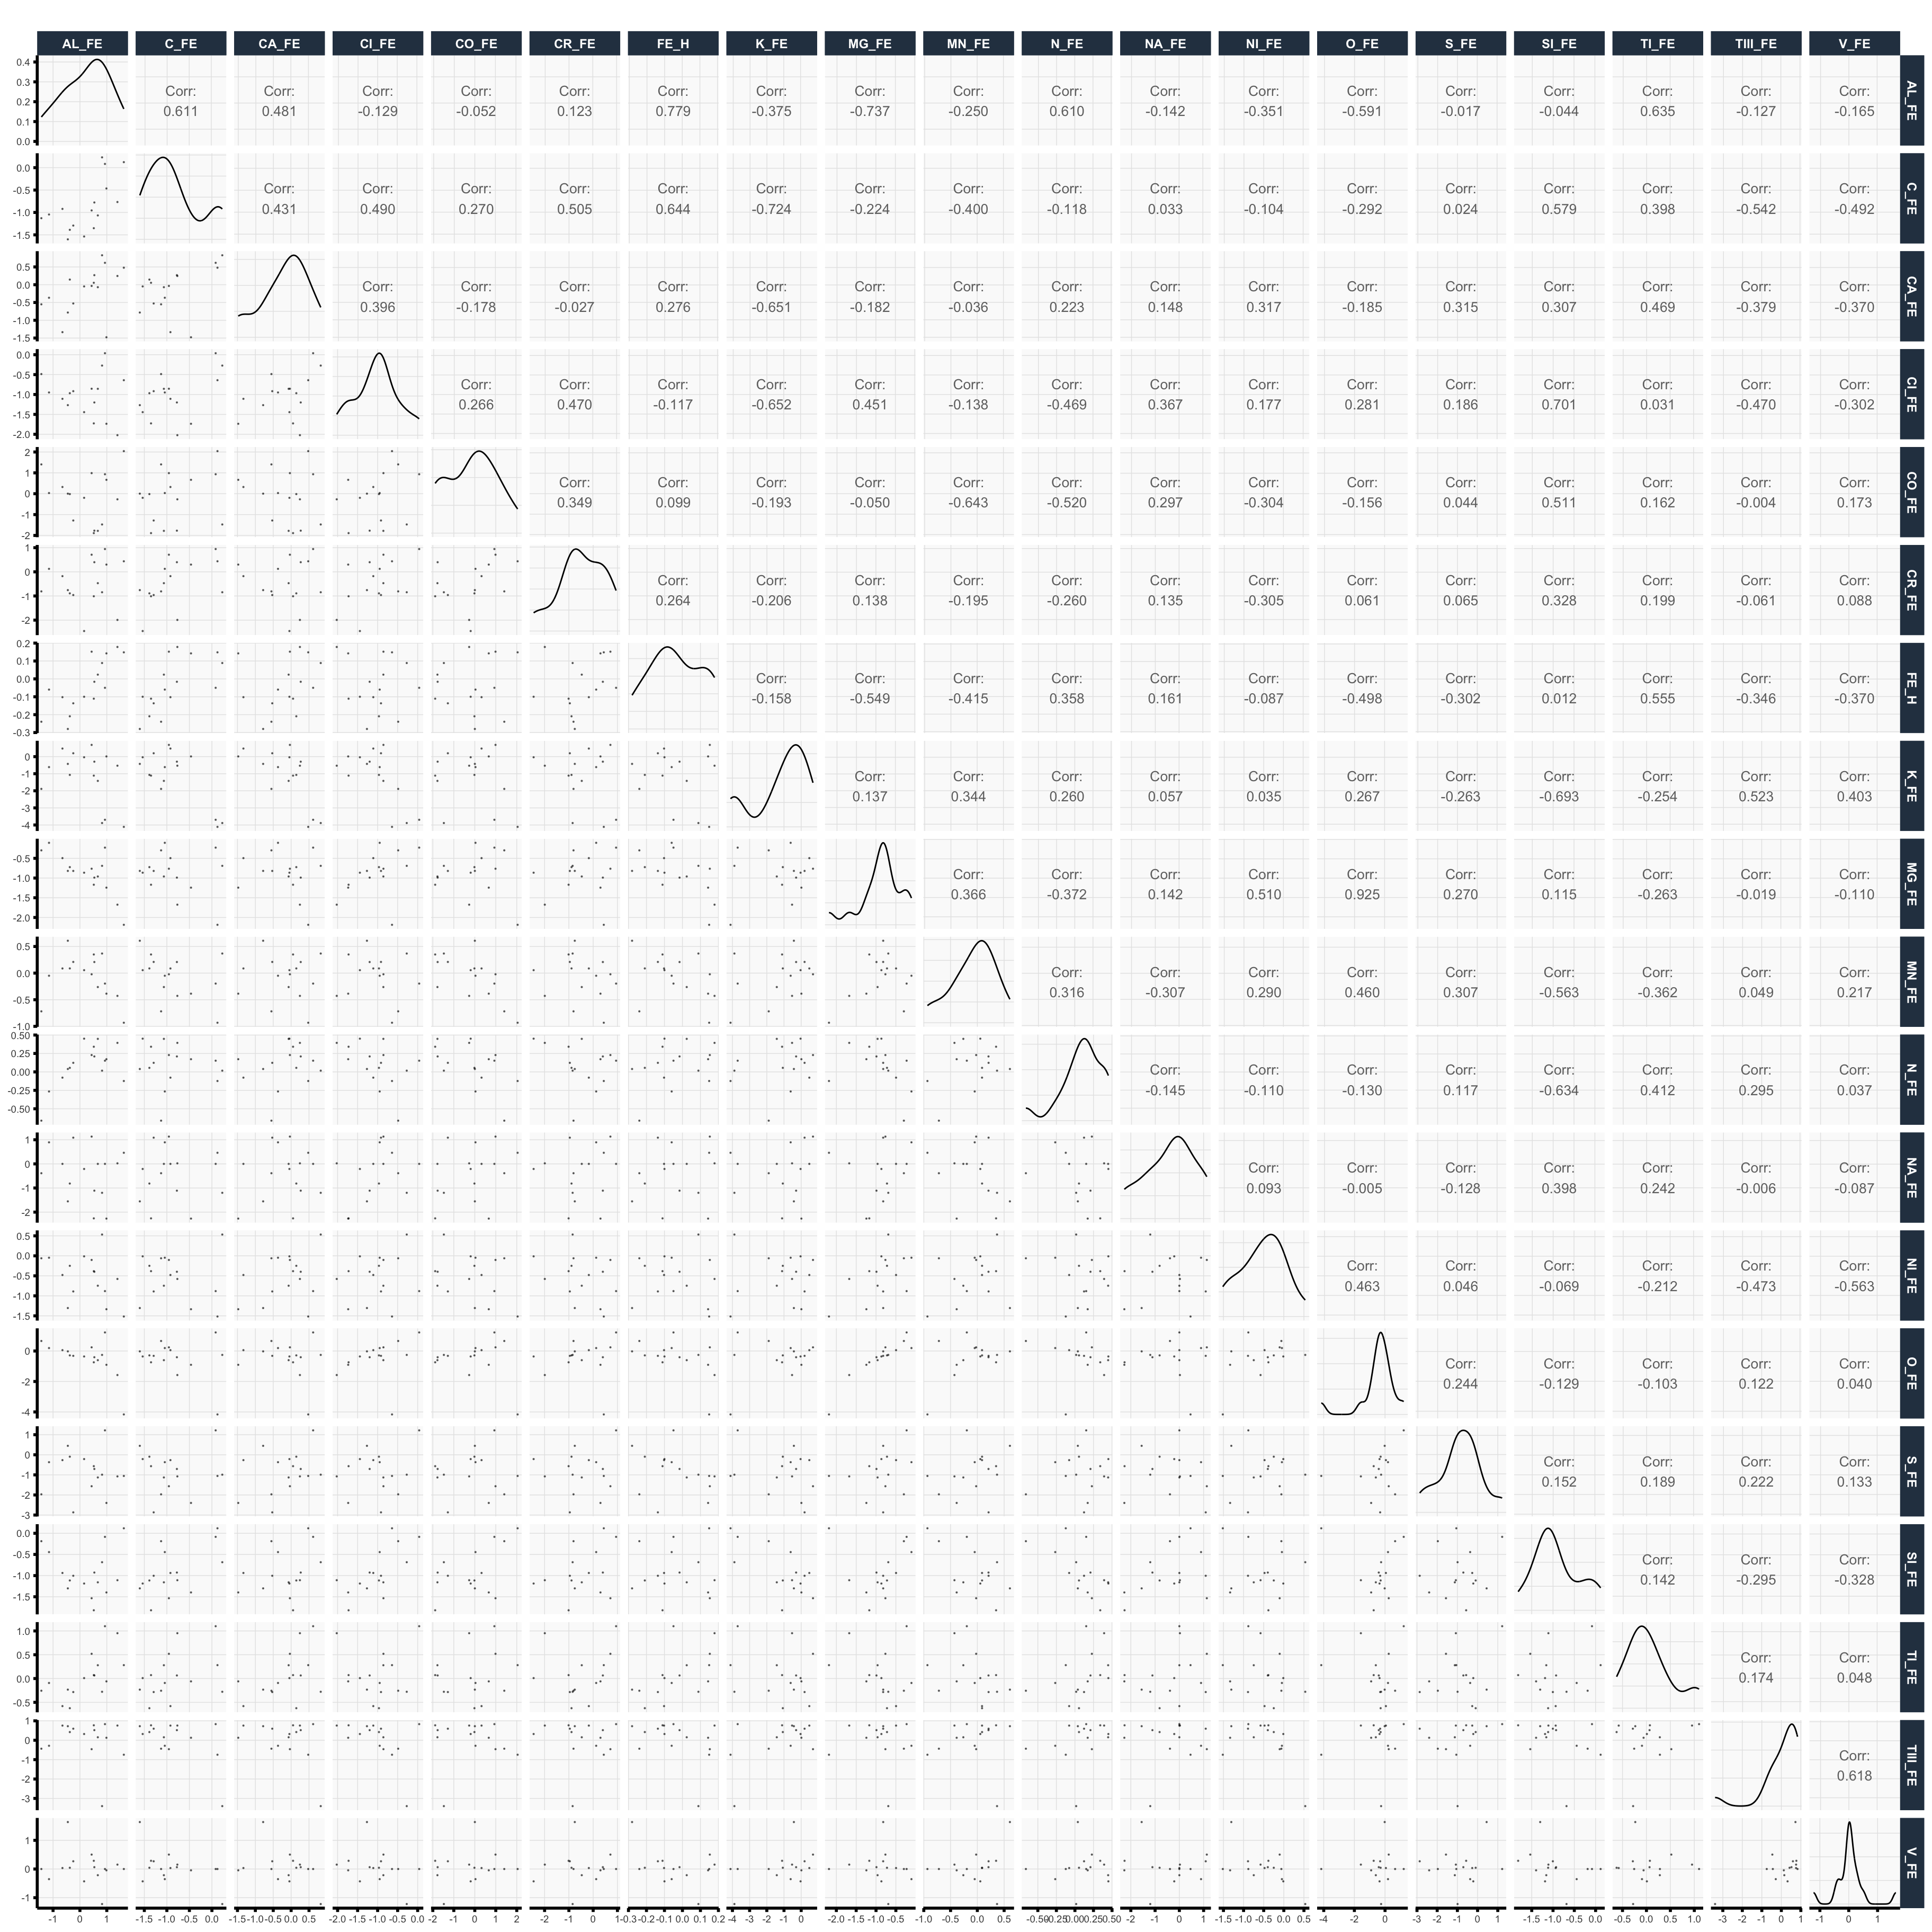
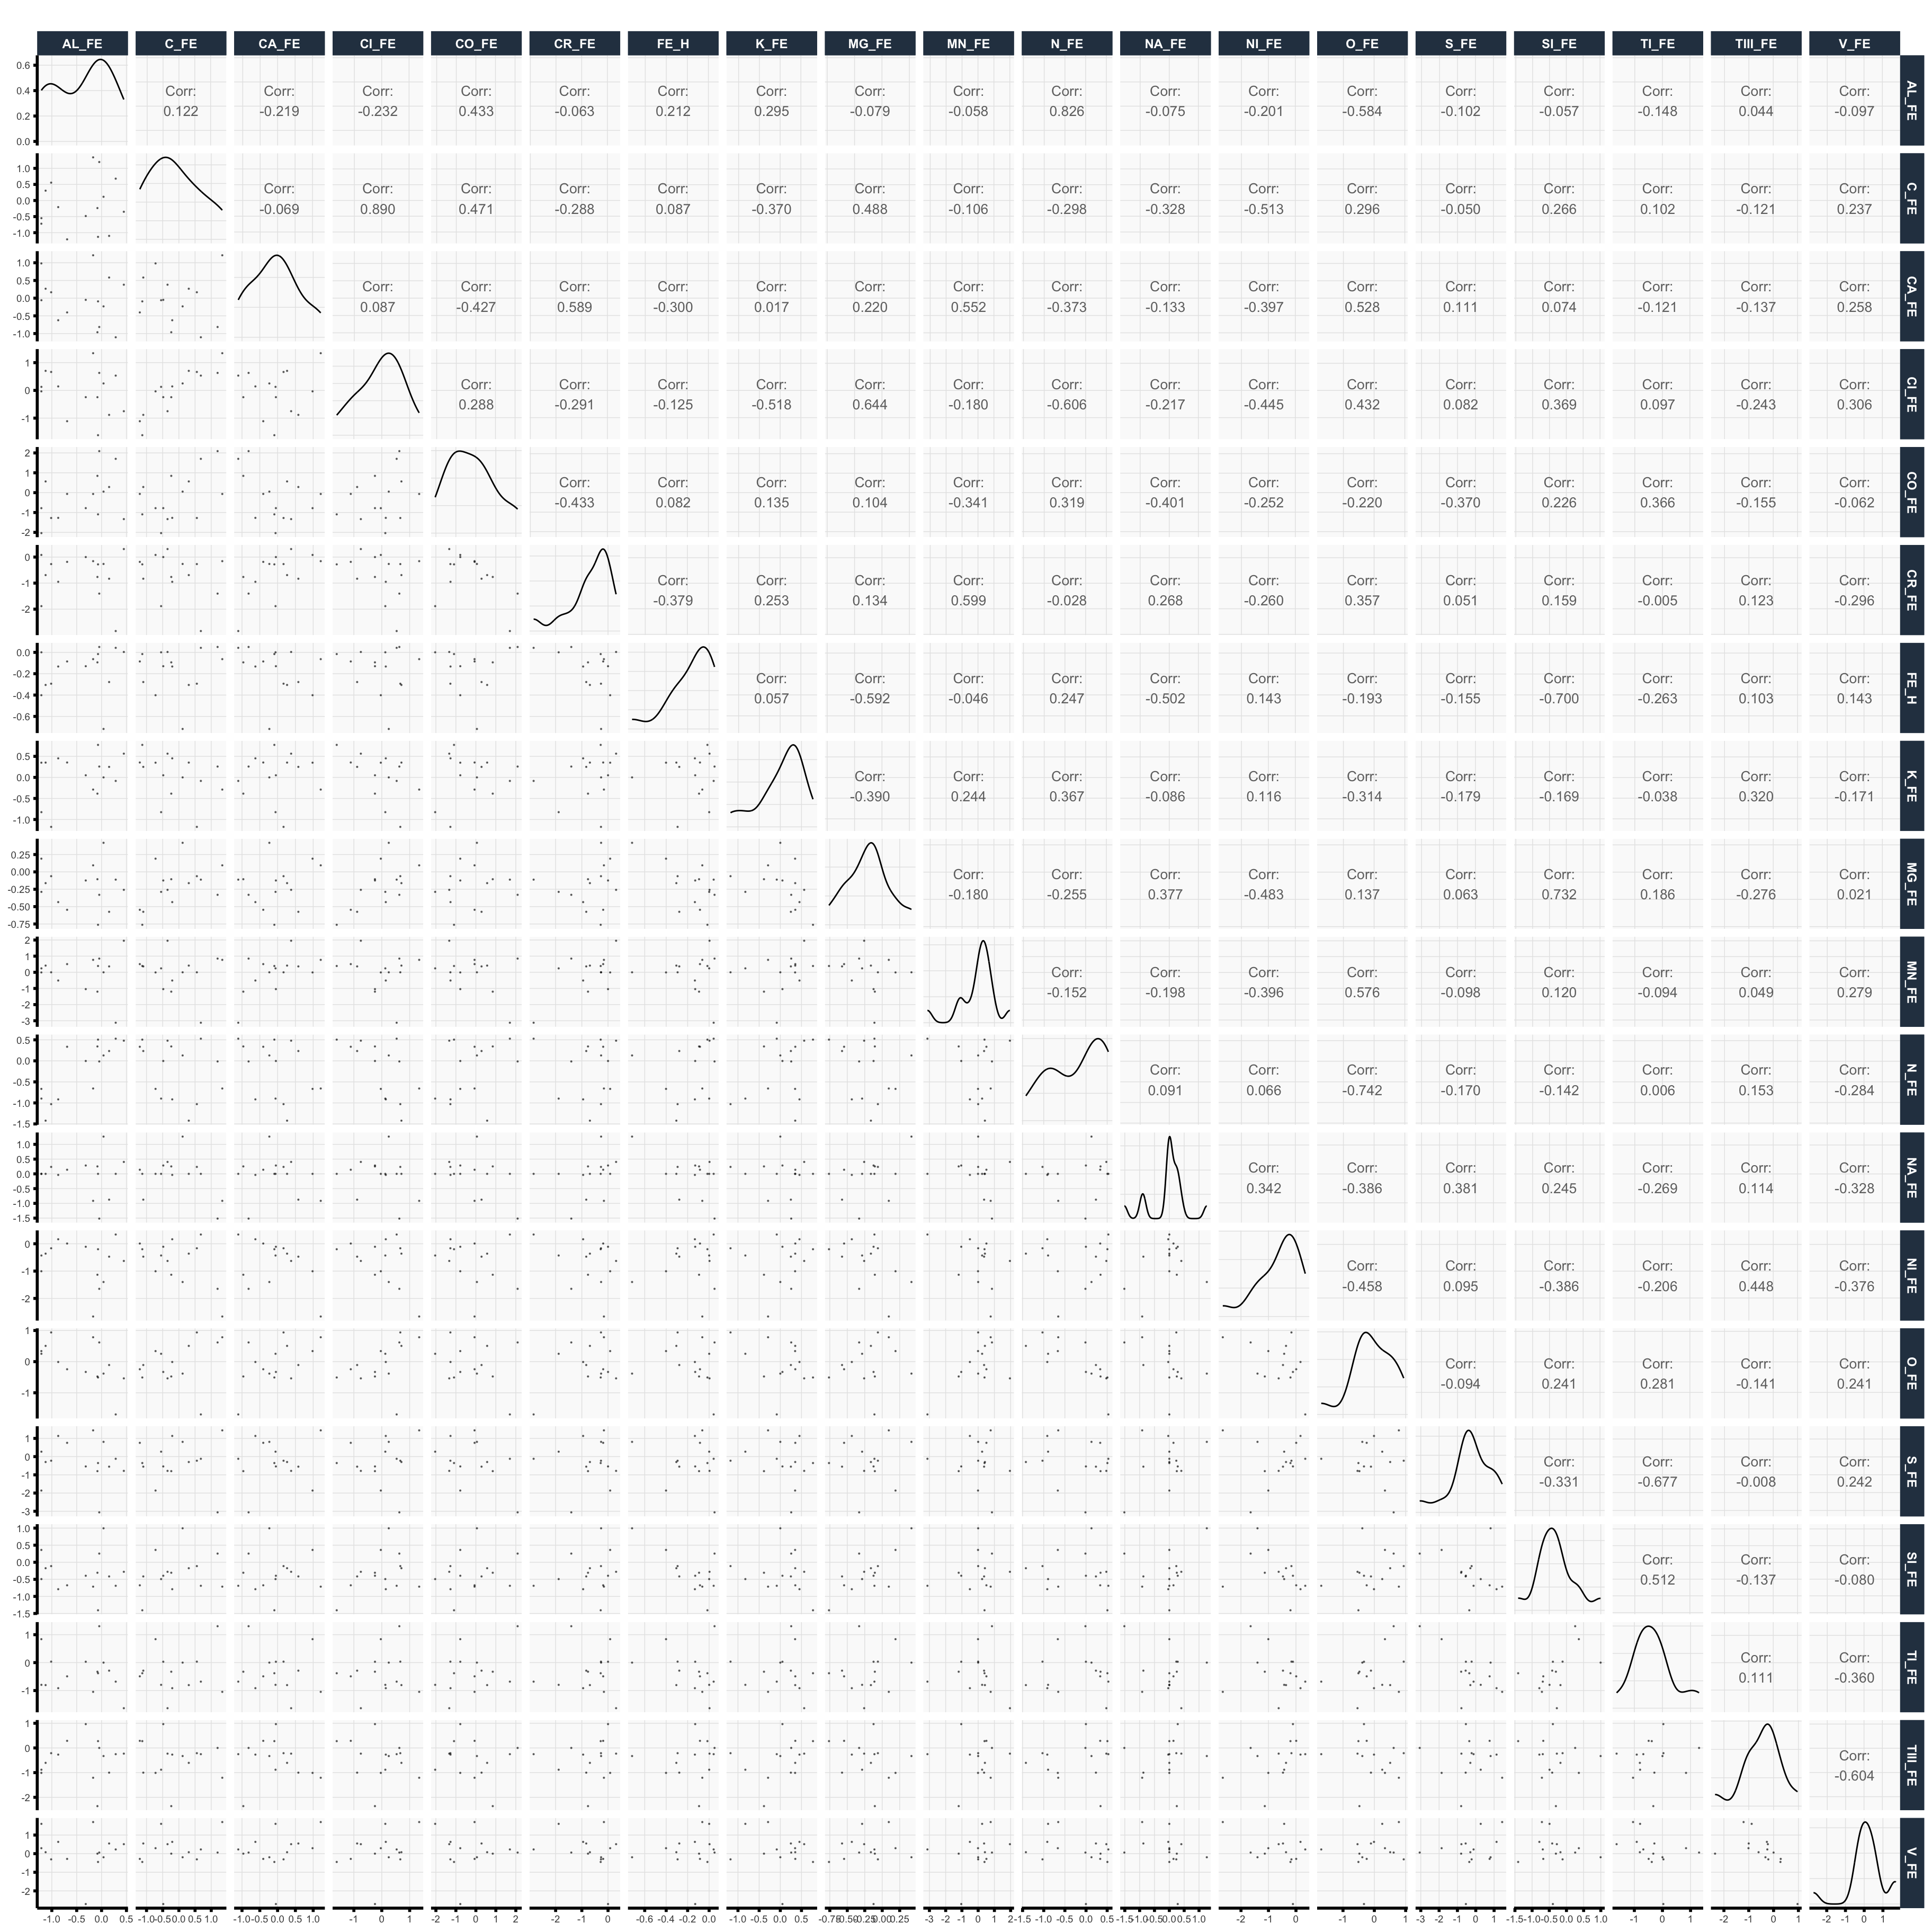
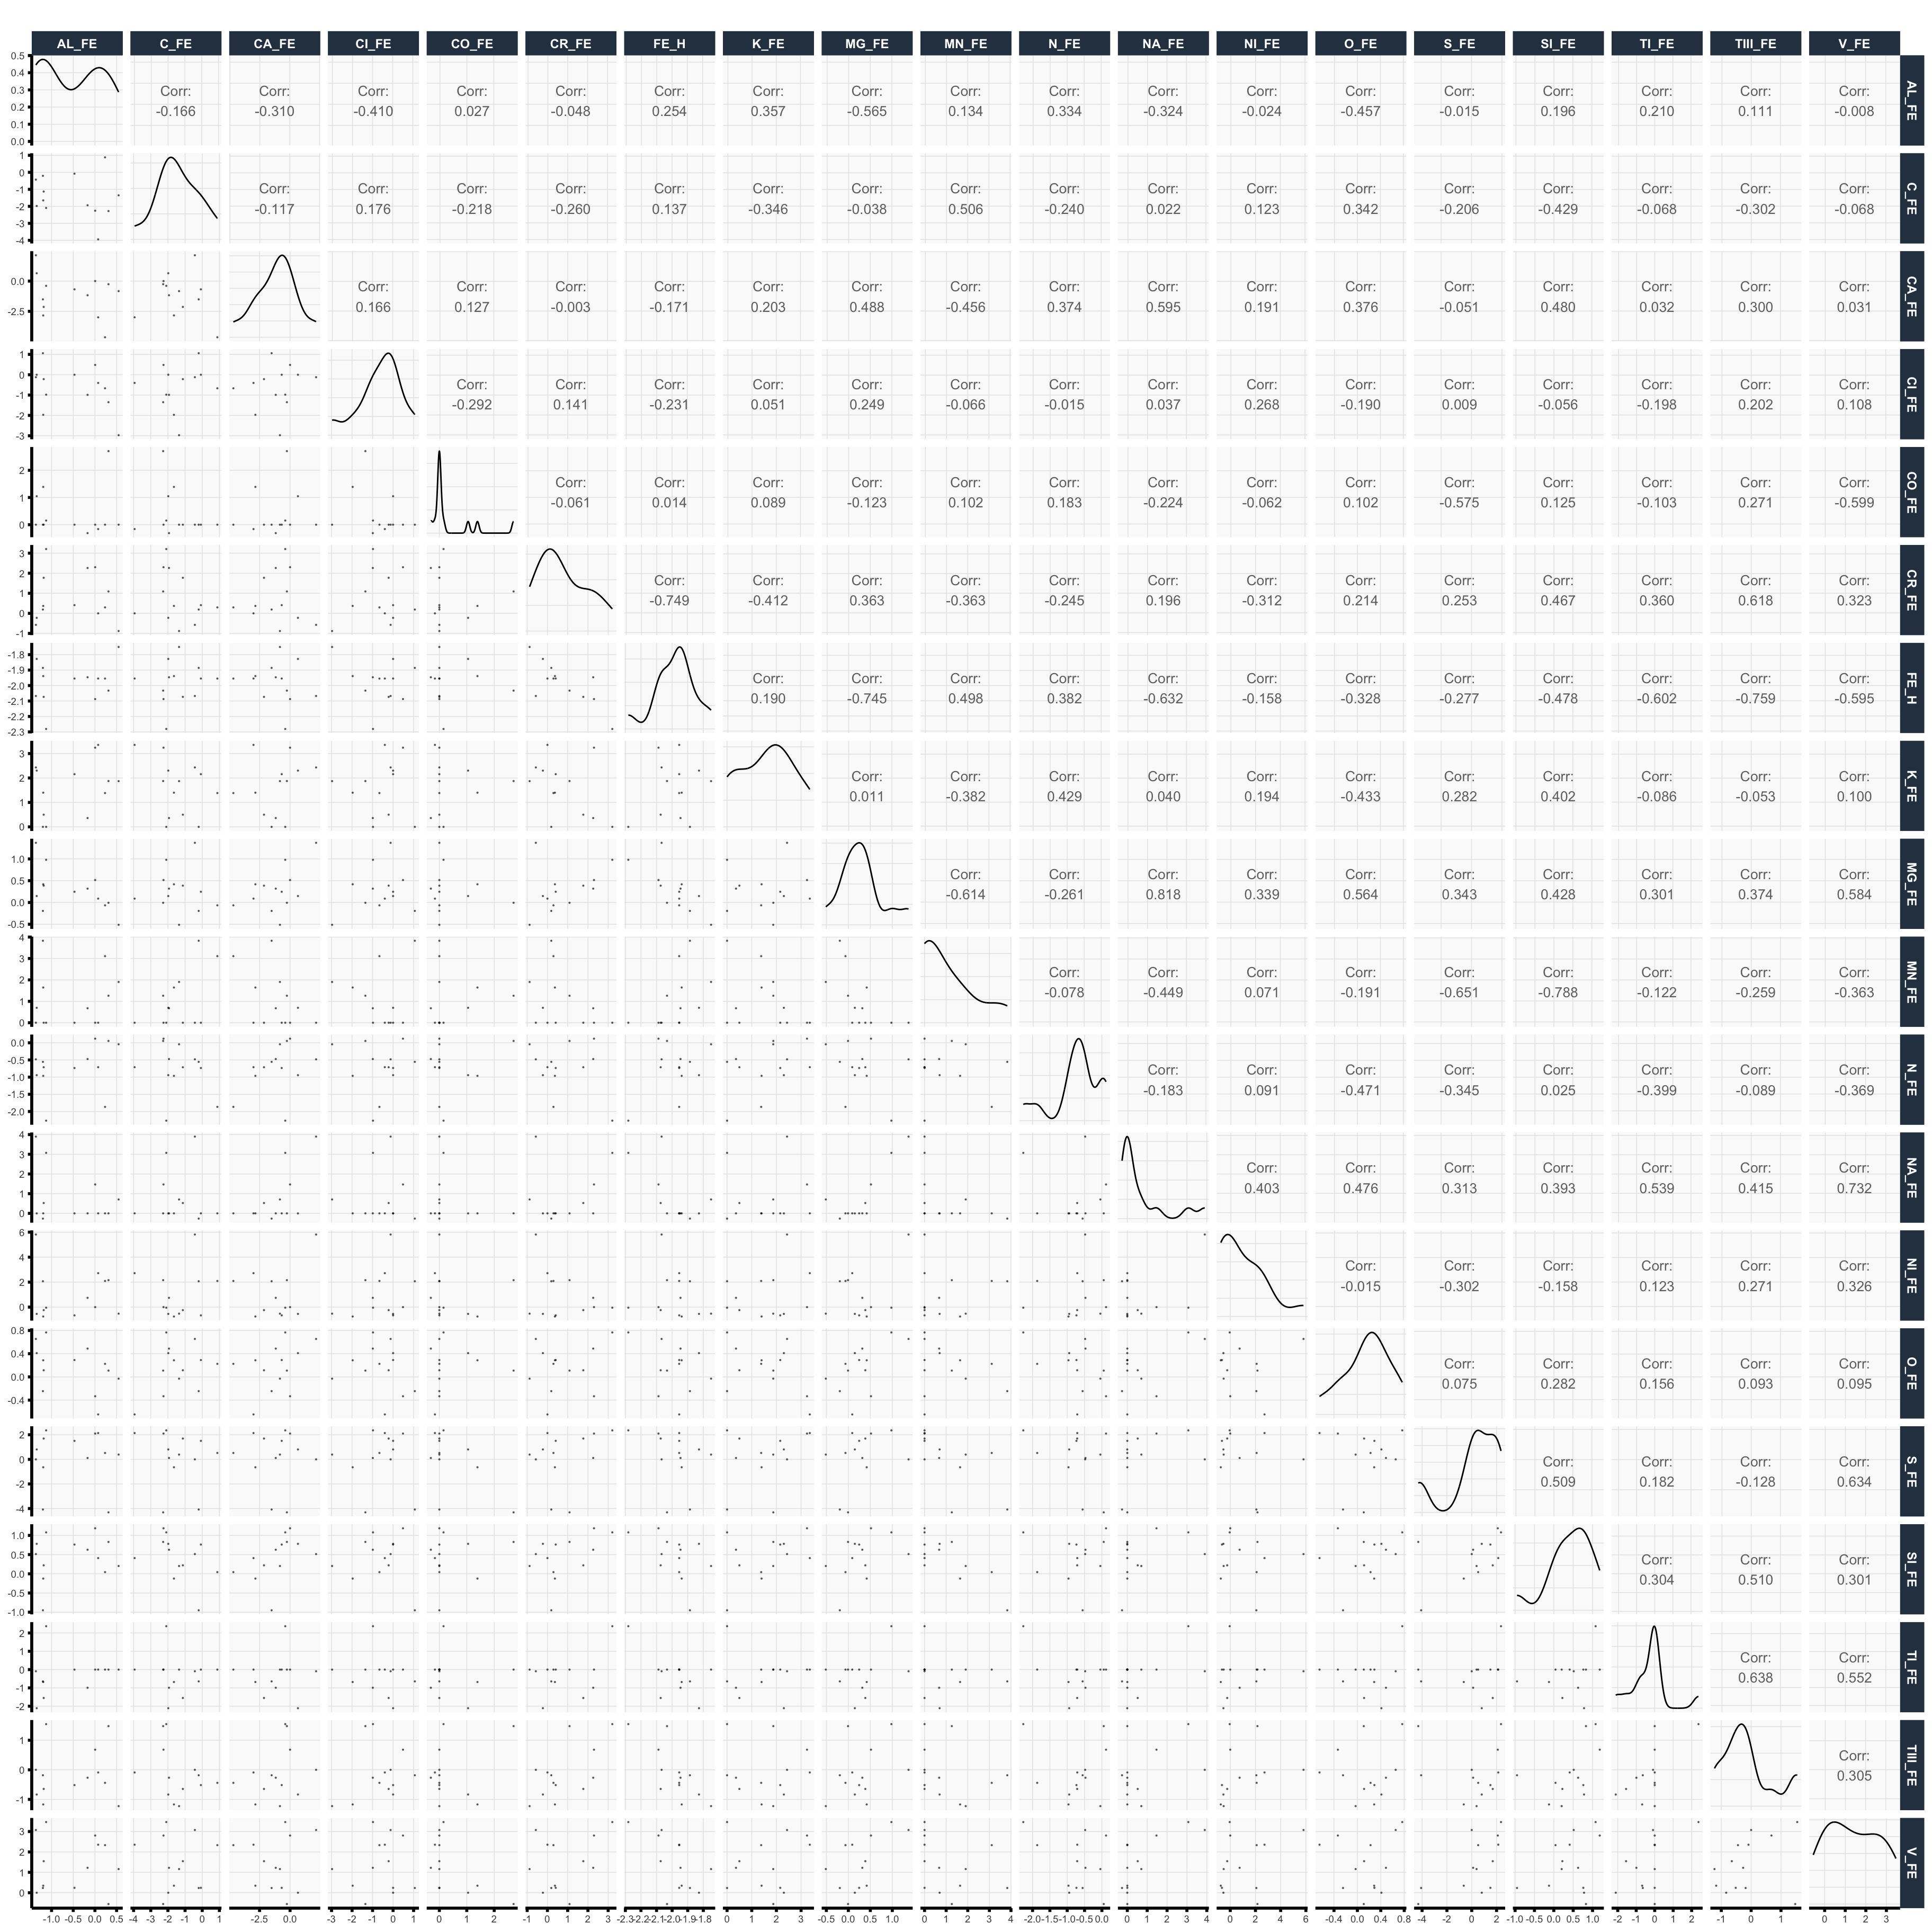
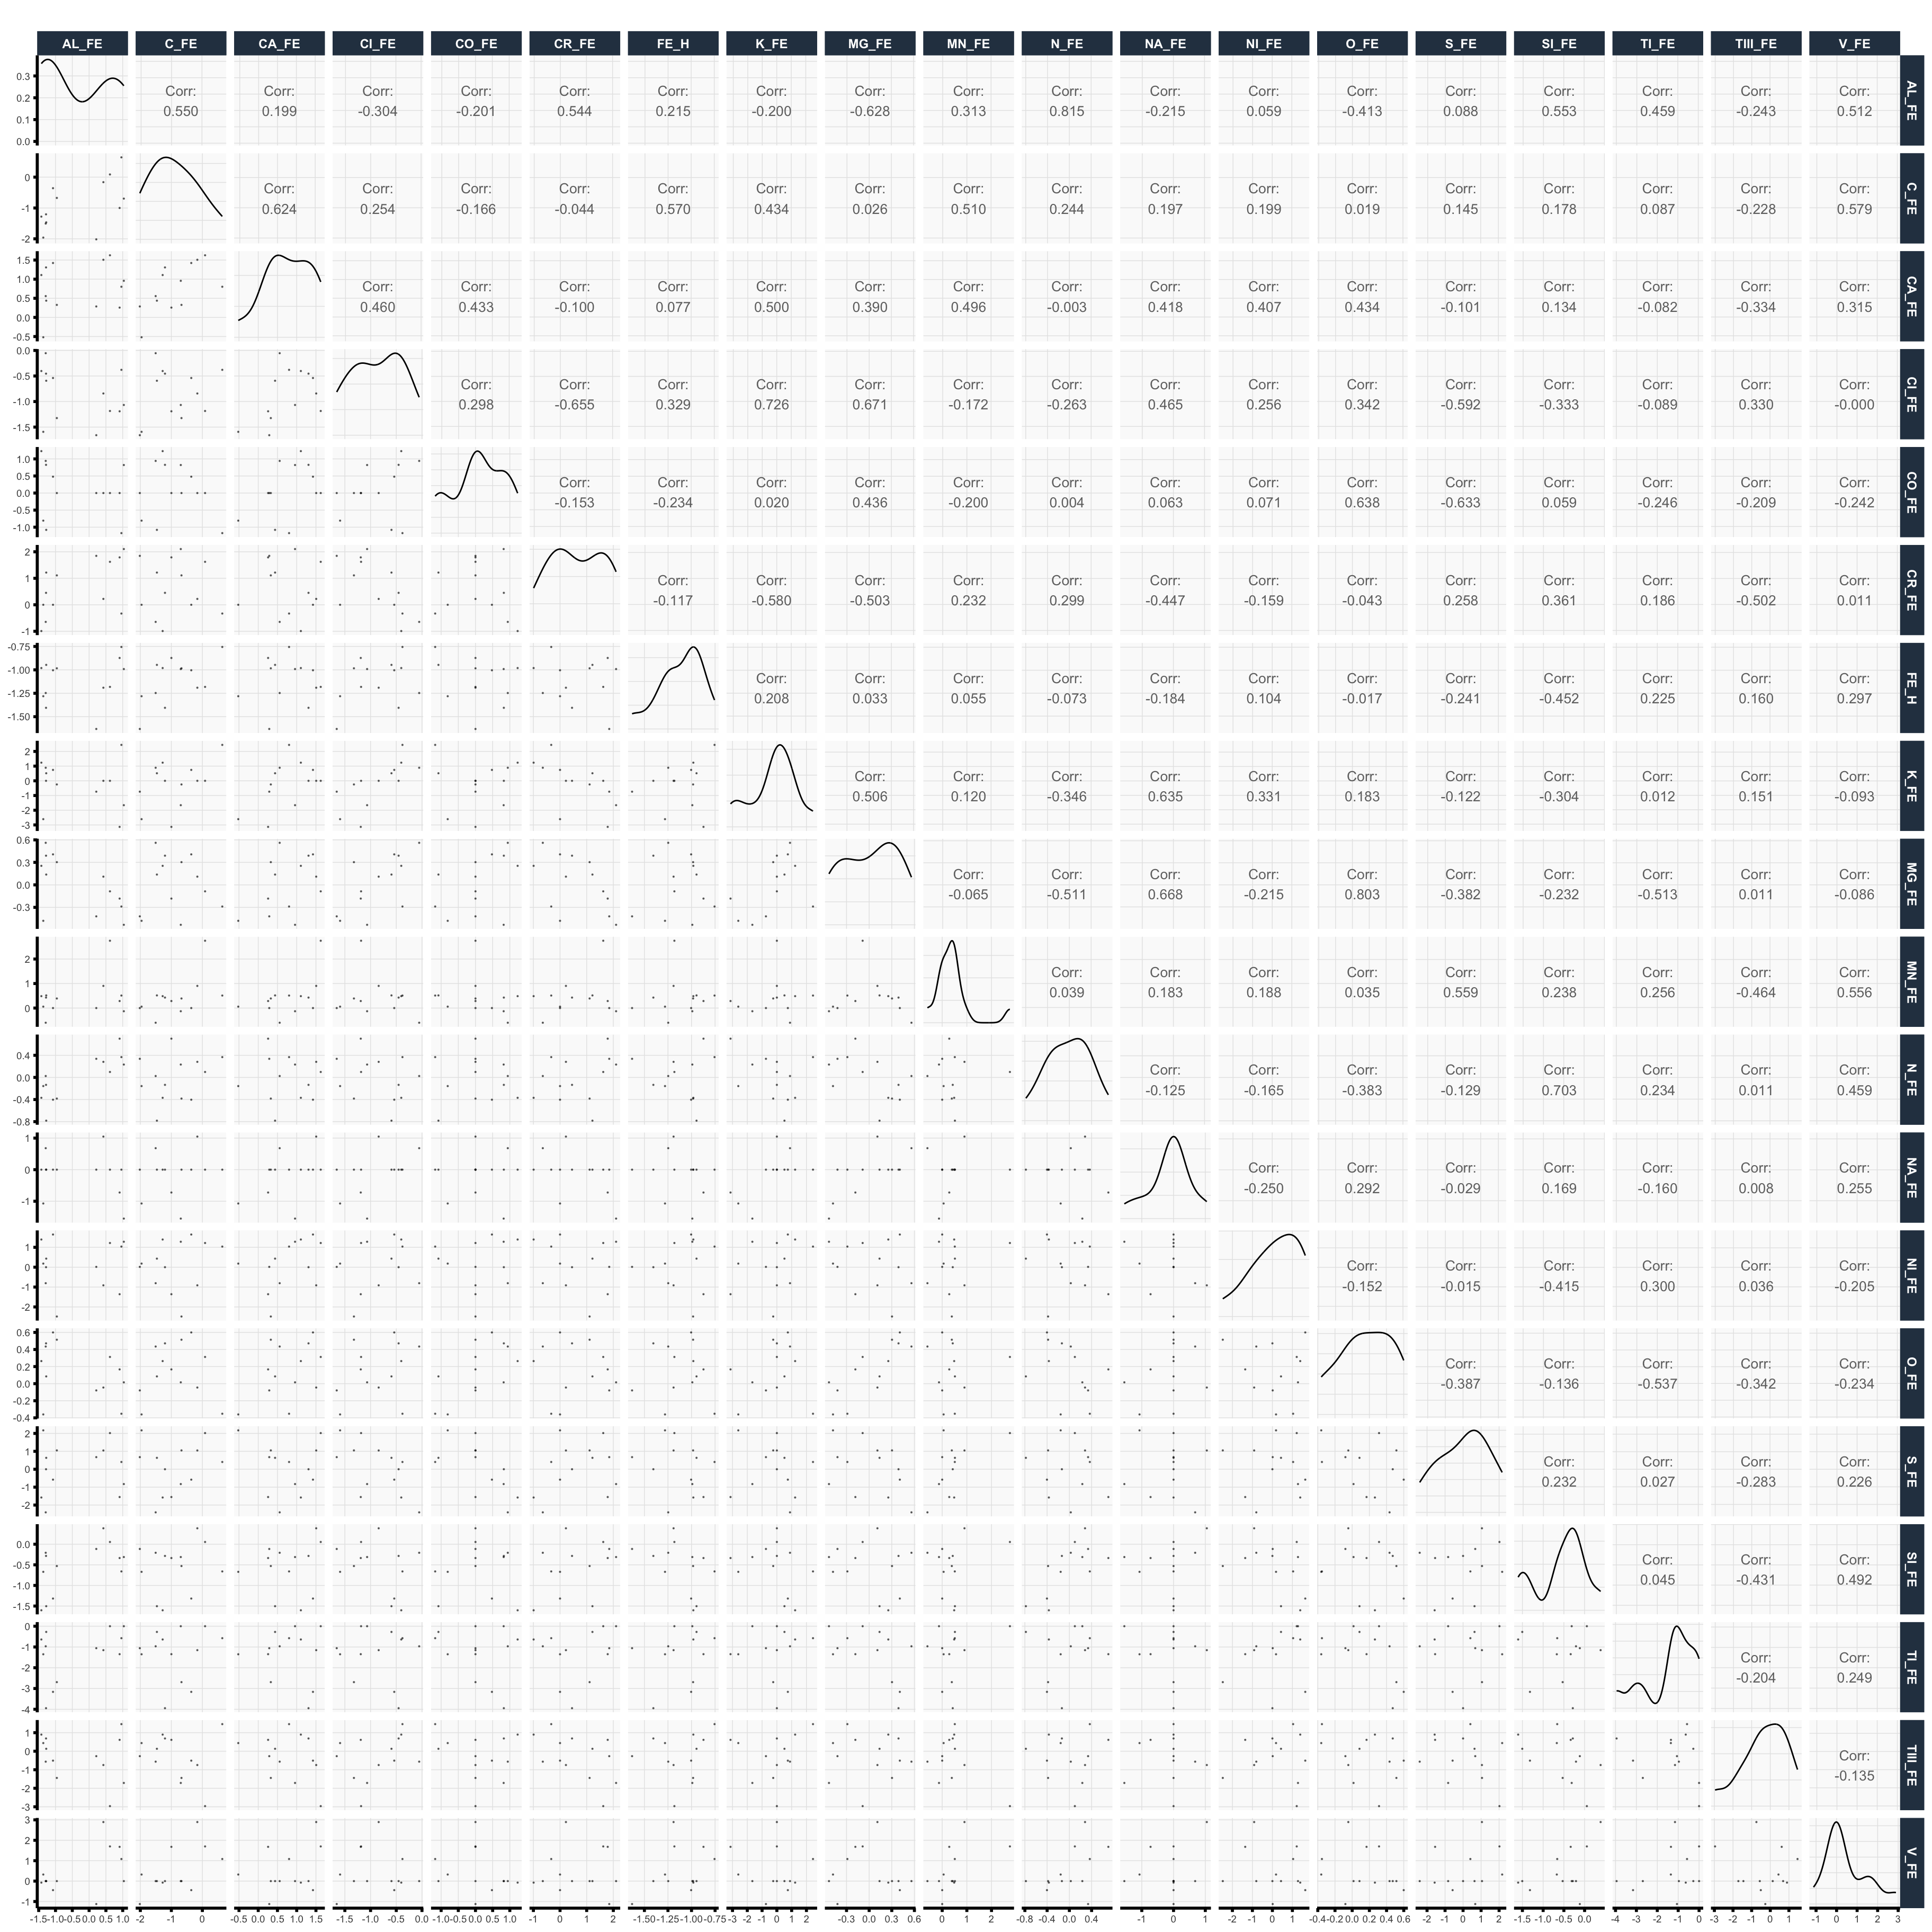
In this section, we conduct a brief exploratory data analysis, visualizing the overall distributions of the chemical abundance data, the galactic coordinates of the stars, and pairwise relationships between the chemical abundance features. For simplicity, all plots shown here are based on the mean-imputed training data.
Show Code
# get X (using mean-imputed) and metadata for EDA <- metadata$ train<- list ("small" = 7 , "medium" = 11 , "big" = 19 )<- purrr:: map (~ get_abundance_data (data_mean_imputed$ train, feature_mode = .x)<- purrr:: map (train_data_ls, ~ colnames (.x))<- train_data_ls$ big
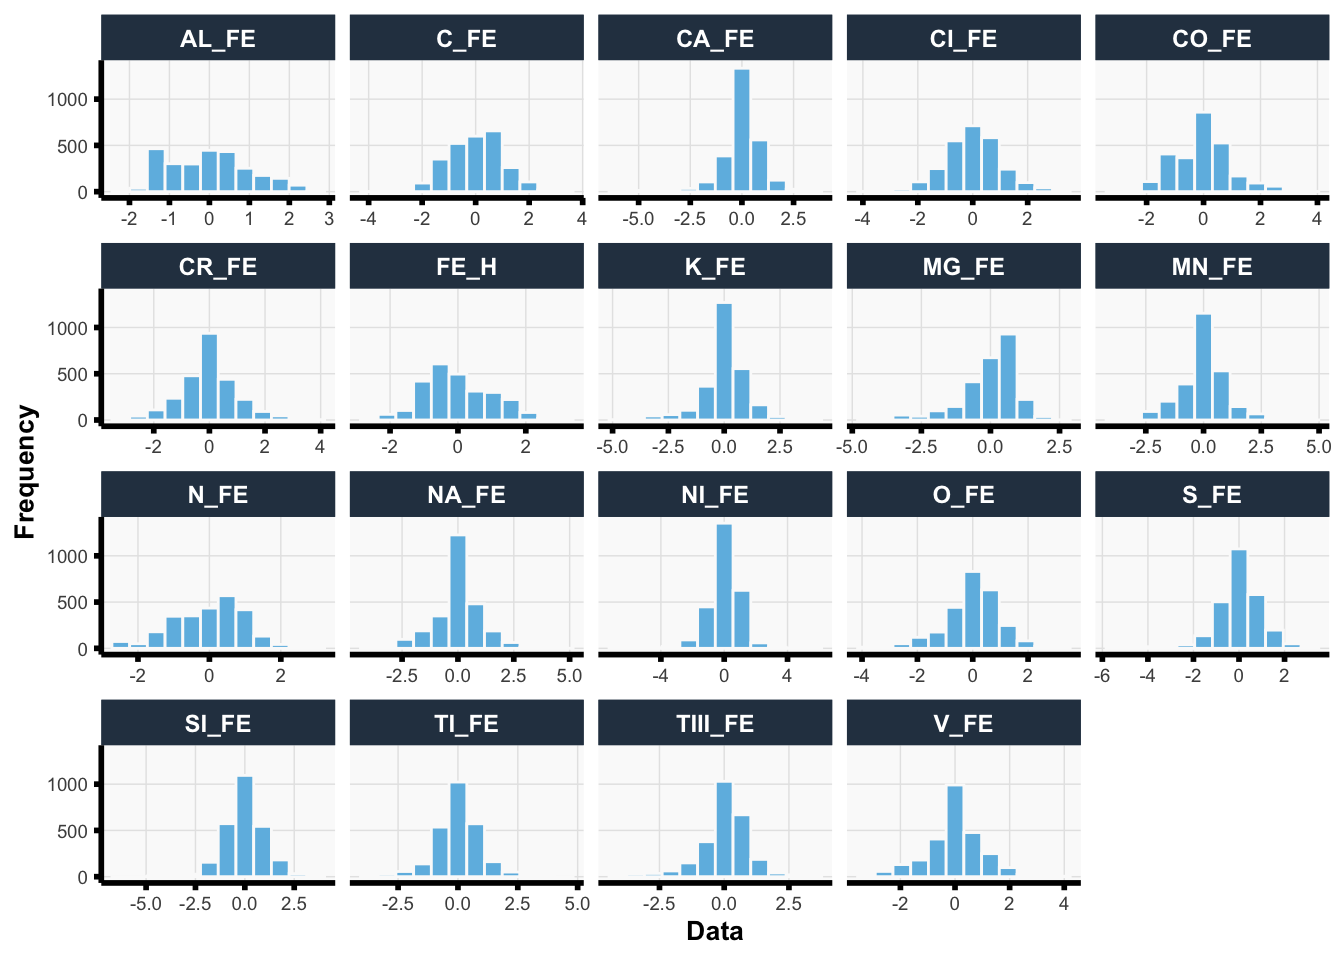
Feature Distributions
Show Code
# plot overall distribution :: plot_histogram (X) + :: facet_wrap (~ variable, scales = "free_x" ) + :: labs (x = "Data" )
Show Code
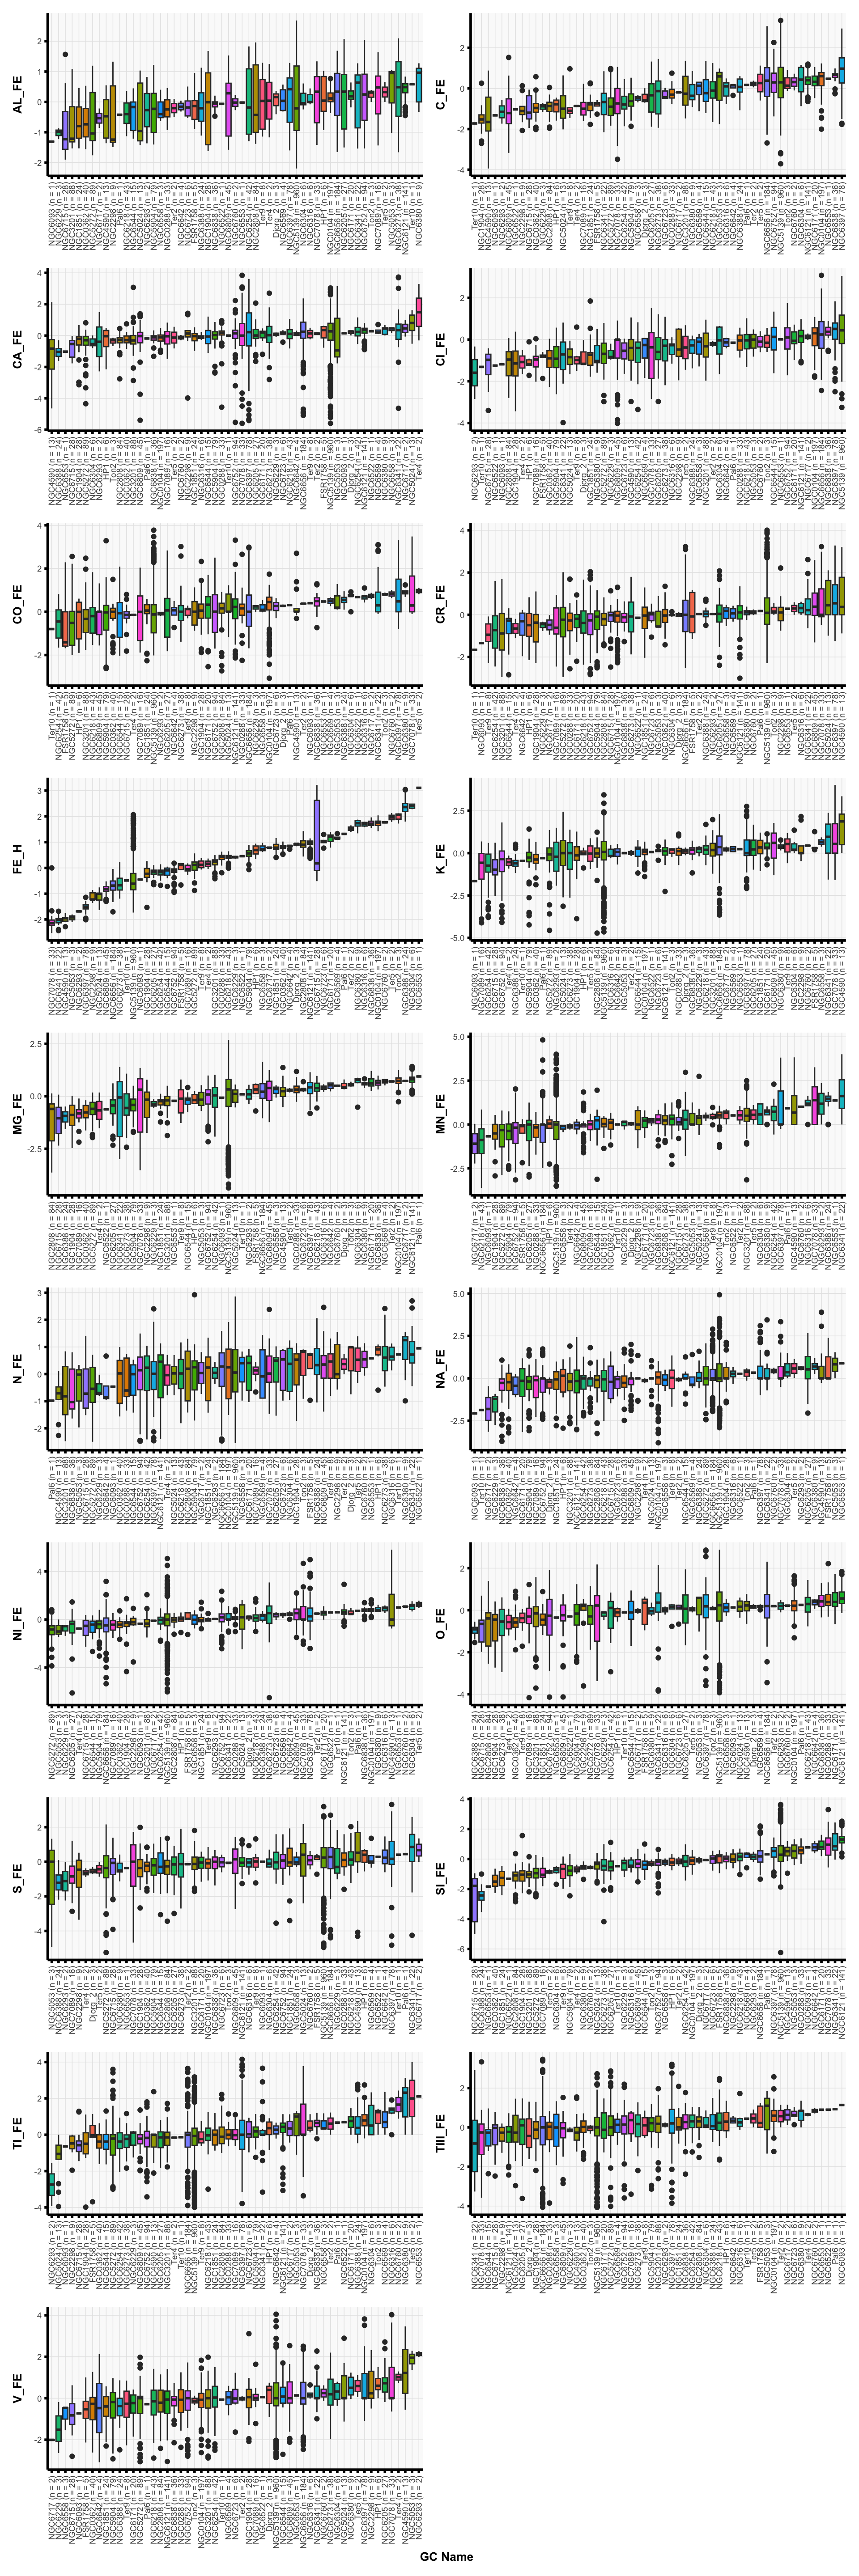
# plot boxplots per GC <- dplyr:: bind_cols (|> dplyr:: select (GC_NAME)|> :: group_by (GC_NAME) |> :: mutate (GC_NAME = sprintf ("%s (n = %d)" , GC_NAME, dplyr:: n ())|> :: ungroup ()<- sort (colnames (X))<- list ()for (plt_var in plt_vars) {<- plt_df |> :: ggplot () + :: aes (x = reorder (GC_NAME, !! rlang:: sym (plt_var)), y = !! rlang:: sym (plt_var),fill = GC_NAME+ :: geom_boxplot () + :: labs (x = "GC Name" ) + :: theme_vmodern () + :: theme (axis.text.x = ggplot2:: element_text (angle = 90 , hjust = 1 , vjust = 0.5 legend.position = "none" <- patchwork:: wrap_plots (plt_ls, ncol = 2 ) + :: plot_layout (axis_titles = "collect" )subchunkify (fig_height = 30 , fig_width = 10 , caption = "'Distribution of abundance values per feature and GC in (mean-imputed) training data.'"
Galactic Coordinate Plots
Unjittered
Unjittered scatter plot of the star locations (given by galactic coordinates), colored by GC_NAME.
Jittered
Jittered scatter plot of the star locations (given by galactic coordinates), colored by GC_NAME.
Unjittered
Unjittered scatter plot of the star locations (given by galactic coordinates), colored by AL_FE.
Jittered
Jittered scatter plot of the star locations (given by galactic coordinates), colored by AL_FE.
Unjittered
Unjittered scatter plot of the star locations (given by galactic coordinates), colored by C_FE.
Jittered
Jittered scatter plot of the star locations (given by galactic coordinates), colored by C_FE.
Unjittered
Unjittered scatter plot of the star locations (given by galactic coordinates), colored by CA_FE.
Jittered
Jittered scatter plot of the star locations (given by galactic coordinates), colored by CA_FE.
Unjittered
Unjittered scatter plot of the star locations (given by galactic coordinates), colored by CI_FE.
Jittered
Jittered scatter plot of the star locations (given by galactic coordinates), colored by CI_FE.
Unjittered
Unjittered scatter plot of the star locations (given by galactic coordinates), colored by CO_FE.
Jittered
Jittered scatter plot of the star locations (given by galactic coordinates), colored by CO_FE.
Unjittered
Unjittered scatter plot of the star locations (given by galactic coordinates), colored by CR_FE.
Jittered
Jittered scatter plot of the star locations (given by galactic coordinates), colored by CR_FE.
Unjittered
Unjittered scatter plot of the star locations (given by galactic coordinates), colored by FE_H.
Jittered
Jittered scatter plot of the star locations (given by galactic coordinates), colored by FE_H.
Unjittered
Unjittered scatter plot of the star locations (given by galactic coordinates), colored by K_FE.
Jittered
Jittered scatter plot of the star locations (given by galactic coordinates), colored by K_FE.
Unjittered
Unjittered scatter plot of the star locations (given by galactic coordinates), colored by MG_FE.
Jittered
Jittered scatter plot of the star locations (given by galactic coordinates), colored by MG_FE.
Unjittered
Unjittered scatter plot of the star locations (given by galactic coordinates), colored by MN_FE.
Jittered
Jittered scatter plot of the star locations (given by galactic coordinates), colored by MN_FE.
Unjittered
Unjittered scatter plot of the star locations (given by galactic coordinates), colored by N_FE.
Jittered
Jittered scatter plot of the star locations (given by galactic coordinates), colored by N_FE.
Unjittered
Unjittered scatter plot of the star locations (given by galactic coordinates), colored by NA_FE.
Jittered
Jittered scatter plot of the star locations (given by galactic coordinates), colored by NA_FE.
Unjittered
Unjittered scatter plot of the star locations (given by galactic coordinates), colored by NI_FE.
Jittered
Jittered scatter plot of the star locations (given by galactic coordinates), colored by NI_FE.
Unjittered
Unjittered scatter plot of the star locations (given by galactic coordinates), colored by O_FE.
Jittered
Jittered scatter plot of the star locations (given by galactic coordinates), colored by O_FE.
Unjittered
Unjittered scatter plot of the star locations (given by galactic coordinates), colored by S_FE.
Jittered
Jittered scatter plot of the star locations (given by galactic coordinates), colored by S_FE.
Unjittered
Unjittered scatter plot of the star locations (given by galactic coordinates), colored by SI_FE.
Jittered
Jittered scatter plot of the star locations (given by galactic coordinates), colored by SI_FE.
Unjittered
Unjittered scatter plot of the star locations (given by galactic coordinates), colored by TI_FE.
Jittered
Jittered scatter plot of the star locations (given by galactic coordinates), colored by TI_FE.
Unjittered
Unjittered scatter plot of the star locations (given by galactic coordinates), colored by TIII_FE.
Jittered
Jittered scatter plot of the star locations (given by galactic coordinates), colored by TIII_FE.
Unjittered
Unjittered scatter plot of the star locations (given by galactic coordinates), colored by V_FE.
Jittered
Jittered scatter plot of the star locations (given by galactic coordinates), colored by V_FE.